
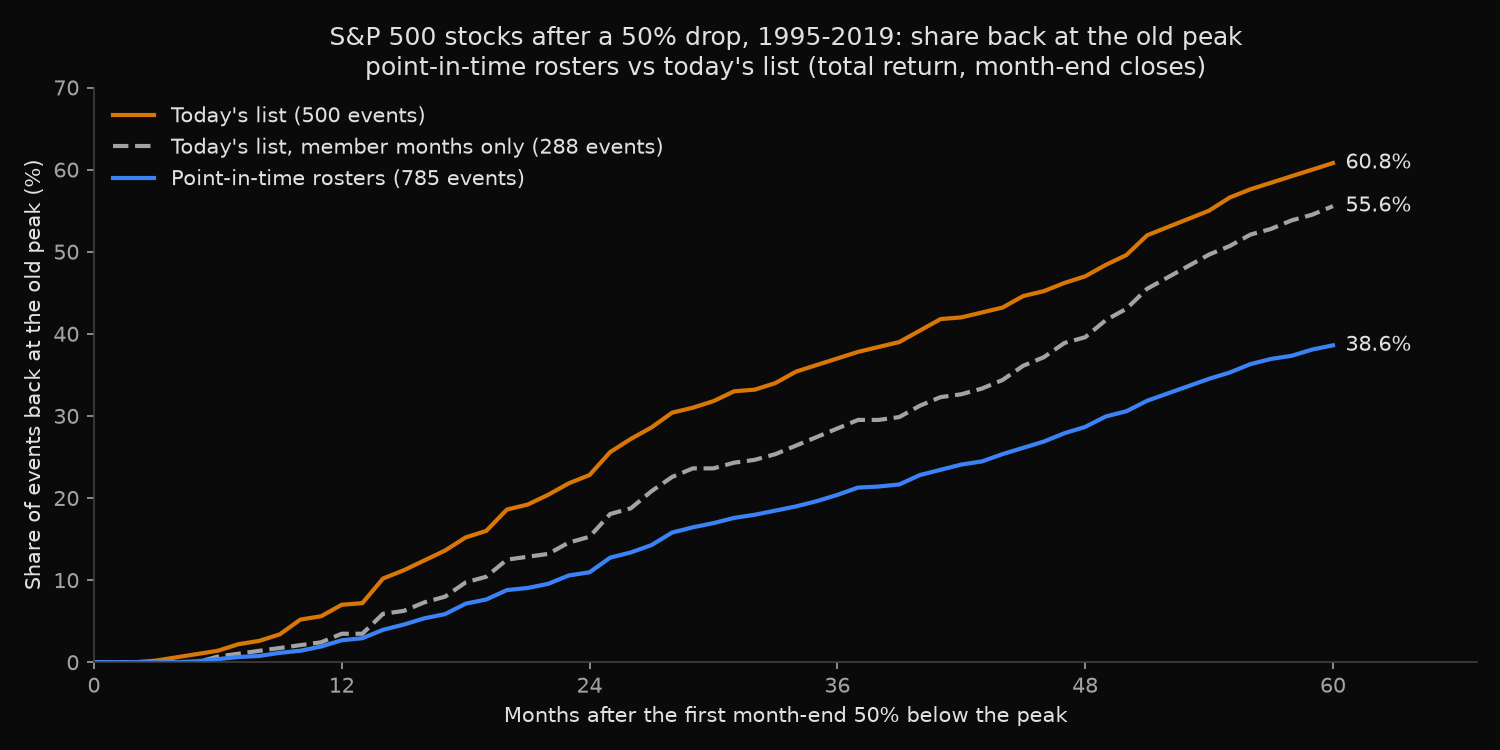
Of the 785 times an S&P 500 member’s total return closed a month 50% below its peak between 1995 and 2019, 38.6% ended back at that peak within five years. Run on today’s S&P 500 list, the same rule reports 60.8%, an overstatement of 22.2 percentage points that comes entirely from which companies and months the list contains. On the rosters of the time, 12.9% of these crashes ended in a takeover, failure or delisting first; on today’s list that outcome barely exists.
Why does a survivor list make every crash look recoverable?
“Buy the dip” arguments often rest on a count: take today’s index members, find every time one lost half its value, and see how often it came back. A company is on today’s list because it is still large and still listed, so Enron, WorldCom and Lehman Brothers cannot appear. Survivorship bias, the error of studying only the units that lasted, here produces a sample in which almost no crash ends with the price series stopping. The fair question: of the stocks actually in the index at the time, how many came back after a halving, and how fast?
Tracing 785 halvings from the rosters of their day
- Rebuild membership from the January 1995 roster and the dated log of additions and removals, the history listed on the historical S&P 500 constituents page; the index membership reference describes the roster call.
- Compound each security’s monthly total return (price plus dividends) from 1990 into an index, following it by
entity_idrather than ticker. - An event is the first month-end close at least 50% below the running peak, in a month the company ends as a member, January 1995 to December 2019. A new episode starts only once the earlier peak is regained.
- Follow each event for 60 months: back at the old peak, price series ended first (acquisition, failure or delisting), or still below. A month without a recorded return ends a series. Where two share classes of one company fall in the same month, one is kept.
- Repeat on today’s list, once with no membership check, as a naive study would, and once counting only months the company was already a member.
The years before a committee drops a company are covered in an analysis of stocks removed from the S&P 500, and a portfolio-level view of the same bias in a study of survivorship bias and S&P 500 drawdown risk.
Code
import numpy as np
import pandas as pd
import xfinlink as xfl

xfl.set_api_key("YOUR_API_KEY")  # free at https://xfinlink.com/signup

DROP, HORIZON = 0.50, 60
FIRST, LAST = pd.Period("1995-01", "M"), pd.Period("2019-12", "M")

# Membership spells: the January 1995 roster plus every 1995-2019 addition and its removal
ev = pd.concat([xfl.index_events("sp500", end="2024-12-31", offset=o)
                for o in range(0, 4000, 1000)], ignore_index=True).dropna(subset=["entity_id"])
ev["entity_id"] = ev["entity_id"].astype(int)
ev["d"] = pd.to_datetime(ev["effective_date"])
r95 = xfl.index("sp500", as_of="1995-01-03").dropna(subset=["entity_id"])
spells = [(int(r.entity_id), pd.Timestamp(r.added_date), pd.Timestamp(r.removed_date))
          for r in r95.itertuples()]
rem = ev[ev["event_type"] == "removed"]
for a in ev[(ev["event_type"] == "added") & ev["d"].between("1995-01-04", "2019-12-31")].itertuples():
    spells.append((a.entity_id, a.d, rem.loc[(rem["entity_id"] == a.entity_id) & (rem["d"] >= a.d), "d"].min()))
spells = pd.DataFrame(spells, columns=["entity_id", "start", "end"])
today = set(xfl.index("sp500")["entity_id"].dropna().astype(int))

ids = sorted(set(spells["entity_id"]) | today)
px = pd.concat([xfl.prices(entity_id=ids[i:i + 300], start="1990-01-01", end="2024-12-31",
                           interval="1mo", fields=["return_daily"], max_rows=200_000)
                for i in range(0, len(ids), 300)], ignore_index=True)
px["m"] = px["date"].dt.to_period("M")
px = px.drop_duplicates(["entity_id", "m"]).sort_values(["entity_id", "m"])

def member_months(eid, months):
    ends = months.to_timestamp(how="end").normalize()
    ok = np.zeros(len(months), bool)
    for s in spells[spells["entity_id"] == eid].itertuples():
        ok |= (ends >= s.start) & (pd.isna(s.end) | (ends <= s.end))
        if pd.notna(s.end):  # removed in the month its shares stopped trading
            ok |= (months == s.end.to_period("M")) & (months == months[-1])
    return ok

def episodes(eid, g, need_member):
    out = []
    g = g.assign(return_daily=g["return_daily"].fillna({g.index[0]: 0.0}))
    seg = g["return_daily"].isna().cumsum()      # a month without a return ends a series
    for _, s in g[g["return_daily"].notna()].groupby(seg):
        r = s.set_index("m")["return_daily"]
        months = pd.PeriodIndex(r.index)
        w = (1 + r).cumprod().to_numpy()         # total-return index
        peak = np.maximum.accumulate(w)
        mem = member_months(eid, months) if need_member else np.ones(len(w), bool)
        k = 0
        while True:
            hit = np.flatnonzero(w[k:] <= (1 - DROP) * peak[k:])
            if not len(hit):
                break
            t = k + hit[0]
            back = np.flatnonzero(w[t + 1:] >= peak[t])
            if FIRST <= months[t] <= LAST and mem[t]:
                if len(back) and back[0] < HORIZON:
                    outcome, mo = "regained the peak", back[0] + 1
                elif len(w) - 1 - t < HORIZON:
                    outcome, mo = "series ended first", np.nan
                else:
                    outcome, mo = "still below at 60 months", np.nan
                out.append({"entity_id": eid, "ticker": s["ticker"].iloc[t], "month": months[t],
                            "outcome": outcome, "months": mo})
            if not len(back):
                break
            k = t + 1 + back[0]                  # new episode only after the peak is regained
    return out

books = {}
for name, universe, need_member in [("Point-in-time rosters", set(spells["entity_id"]), True),
                                    ("Today's list", today, False),
                                    ("Today's list, member months only", today, True)]:
    rows = []
    for eid, g in px[px["entity_id"].isin(universe)].groupby("entity_id"):
        rows += episodes(eid, g.reset_index(drop=True), need_member)
    book = pd.DataFrame(rows)
    book["company"] = book["entity_id"].map(px.groupby("entity_id")["entity_name"].last())
    b = books[name] = book.drop_duplicates(["company", "month"])   # one share class per company
    print(name, len(b), b["outcome"].value_counts(normalize=True).round(3).to_dict(),
          b["months"].median())
Full script with formatting and visualisation: stock-recovery-after-50-percent-drop-python.py
Output
S&P 500 spells 1995-2019: 1189 (1164 securities); today's list: 502
Events: the first month-end close 50%+ below the running peak of the total-return index, 1995-2019, followed 60 months

                                   events  cos  regained    ended  below  median mo
Point-in-time rosters                 785  638     38.6%    12.9%  48.5%       35.0
Today's list                          500  337     60.8%     0.2%  39.0%       28.5
Today's list, member months only      288  219     55.6%     0.0%  44.4%       36.0

Share back at the old peak within N months of the 50% close
  Point-in-time rosters              12m   2.7%  24m  11.0%  36m  20.4%  60m  38.6%
  Today's list                       12m   7.0%  24m  22.8%  36m  37.0%  60m  60.8%
  Today's list, member months only   12m   3.5%  24m  15.3%  36m  28.5%  60m  55.6%

Point-in-time events, split by today's list
  company on today's list       288 events: regained 55.6%, ended 0.0%, below 44.4%
  company not on today's list   497 events: regained 28.8%, ended 20.3%, below 50.9%
Today's-list events in months the company was not yet (or no longer) a member: 212
Series ended first (101): last close vs old peak, median -53.1%; within 25% of the peak 23; 90%+ below 25

Regained the peak within 60 months, by the deepest month-end before regaining
  Point-in-time rosters             50-60% down  74.3% (n=214)  60-75% down  45.3% (n=254)  75%+ down   9.1% (n=317)
  Today's list                      50-60% down  87.2% (n=172)  60-75% down  64.1% (n=181)  75%+ down  25.9% (n=147)
  Today's list, member months only  50-60% down  82.7% (n= 98)  60-75% down  58.4% (n=113)  75%+ down  16.9% (n= 77)

Named events (point-in-time book; ticker in force at the event)
  LU    2000-09  peak 1999-12  deepest  -98.7%  still below at 60 months
  CSCO  2000-12  peak 2000-03  deepest  -86.4%  still below at 60 months
  AAPL  2000-09  peak 2000-03  deepest  -79.2%  regained the peak        52 months
  ENE   2001-08  peak 2000-09  deepest  -99.7%  series ended first
  WCOM  2000-10  peak 1999-03  deepest  -99.6%  series ended first
  C     2008-02  peak 2006-12  deepest  -97.0%  still below at 60 months
  AIG   2008-02  peak 2000-12  deepest  -99.5%  still below at 60 months
  LEH   2008-03  peak 2007-01  deepest  -99.8%  series ended first
  WB    2008-03  peak 2006-04  deepest  -93.4%  series ended first
  BBY   2008-10  peak 2006-04  deepest  -76.4%  still below at 60 months
  AMZN  2008-11  peak 2007-09  deepest  -54.2%  regained the peak        10 months
  NFLX  2011-09  peak 2011-05  deepest  -79.9%  regained the peak        23 months
Where the 22 missing points of recovery went
The dashed line in the chart splits the gap in two. Leaving out companies no longer in the index accounts for 17.0 points: the 288 events of companies still on today’s list recovered 55.6% of the time, while the 497 events of companies that left recovered 28.8% of the time and series ended first 20.3% of the time. Adding crashes from before a company joined accounts for the other 5.2 points. Those 212 events fall in months before the company joined, or between its spells; a list drawn in 2026 keeps only firms that went on to join, which tilts them toward recovery.
Depth, measured after the fact as the lowest month-end before recovery or month 60, separates outcomes more than anything else in the table. Members whose deepest month-end stayed between 50% and 60% below the peak got back 74.3% of the time; those that went past 75% got back 9.1% of the time. Today’s list holds fewer of the deepest crashes (147 of 500, against 317 of 785) and reports a higher rate inside each band: 25.9% for the deepest, against 9.1%.
Recoveries on the dated rosters were also slower: a median of 35 months against 28.5. Apple, 79.2% below its March 2000 peak at the worst, needed 52 months; Amazon in 2008 needed 10. Cisco and Citigroup were still below five years on, while the price series of Enron, WorldCom and Lehman Brothers ended after delisting and Wachovia’s ended with its takeover.
Not every ended series is a failure: of the 101, 25 last closed 90% or more below the peak, but 23 closed within 25% of it.
Pricing the odds of a comeback after a halving
A large-cap stock that has lost half its value is more likely to stay below its peak than to regain it within five years, and about one in eight saw its price series end first. A fall that stops between 50% and 60% recovered three times in four; one that runs past 75% rarely did.
A recovery study should draw its universe from the roster on each event date and treat the end of a price series as an outcome, not missing data. A buy-the-dip rule should be sized on the 38.6% figure, not the 60.8% a current list reports, and should plan for the case that is rare on today’s list and common in history: a listing that ends before the peak returns. The depth bands describe where a fall bottomed, which is known only afterwards.
Built with xfinlink — free financial data API for Python.