
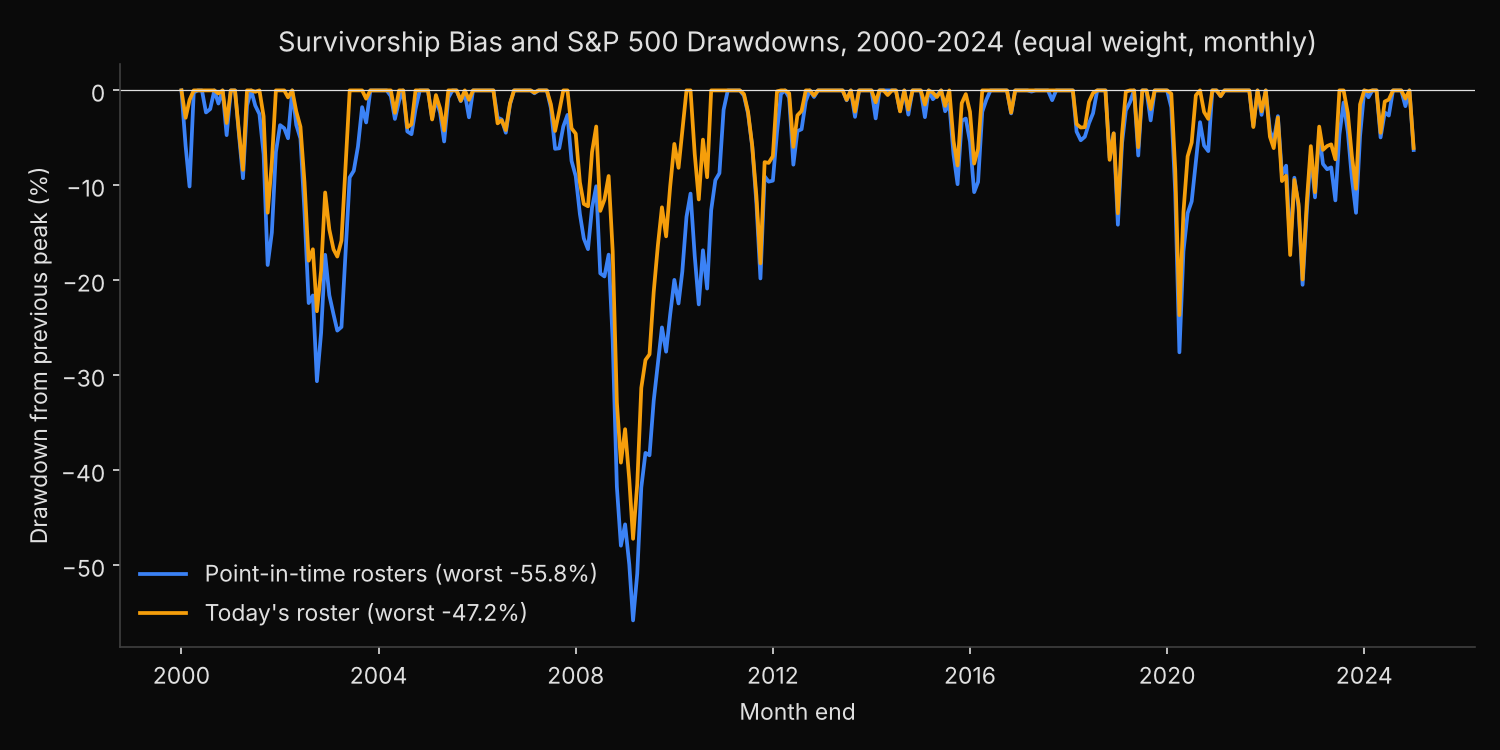
Survivorship bias understates risk as well as overstating return. An equal-weight S&P 500 portfolio rebuilt from each month’s actual roster fell 55.8% from its May 2007 peak to February 2009, while the same portfolio built from today’s roster fell 47.2% and was back at its peak by March 2010, ten months earlier. Volatility barely separates them, 17.69% against 16.77% a year: the hidden risk lies in how deep and long the losses ran.
Does a survivor roster make a backtest look safer?
Survivorship bias is the error of testing on a universe chosen with knowledge of the future, here the companies in the S&P 500 today. Its lift to returns is well documented; its effect on risk matters as much, because backtest risk figures set position sizes and the loss a fund prepares for.
Volatility is the annualised standard deviation of monthly returns. Maximum drawdown is the largest fall from a running peak to a later low. The Sharpe ratio divides average annual return by volatility, with the risk-free rate set to zero.
The direction is not obvious in advance. Run back to 2000, today’s roster holds companies that were then young, such as Akamai and Intuitive Surgical, and young stocks swing more. The point-in-time rosters hold the companies that later failed, such as Enron and Lehman Brothers.
Building both books from 300 month-end rosters
- Draw the S&P 500 roster on the last business day of each month from December 1999 to November 2024 with
xfl.index("sp500", as_of=...). Each sets the next month’s holdings, January 2000 to December 2024. - Draw today’s roster once and apply it to every month.
- Pull monthly total returns for every security either book holds, keyed by entity id so a recycled ticker cannot swap companies.
- Hold each book in equal weight across members with a return that month. A member removed mid-month stays to month end; one that stops trading earns its return through its last trading day.
- Measure both books on month-end values, then follow each company over the months the book held it: did it fall 80% or more from its own peak, and was it still that far down in its last month held?
The index membership reference documents the as_of call; this many dated rosters and 25 years of prices need a paid plan.
Code
import numpy as np
import pandas as pd
import xfinlink as xfl

xfl.set_api_key("YOUR_API_KEY")  # free at https://xfinlink.com/signup

# The S&P 500 roster on the last business day of each month, Dec 1999 to Nov 2024,
# sets the holdings for the following month
dates = pd.date_range("1999-12-01", "2024-11-30", freq="BME")
pit = {d.to_period("M") + 1: set(xfl.index("sp500", as_of=d.strftime("%Y-%m-%d"))
                                 .entity_id.dropna().astype(int)) for d in dates}
today = set(xfl.index("sp500").entity_id.dropna().astype(int))

# Monthly total returns, keyed by entity id, for every company either book holds
ids = sorted(set().union(*pit.values()) | today)
px = pd.concat(xfl.prices(entity_id=ids[i:i + 25], start="1999-12-01", end="2024-12-31",
                          interval="1mo", fields=["return_daily"], max_rows=100_000)
               for i in range(0, len(ids), 25))
px["month"] = px["date"].dt.to_period("M")
ret = px.pivot(index="month", columns="entity_id", values="return_daily").loc["2000-01":]
print(f"{len(pit)} monthly rosters, {len(ids)} securities, {len(ret)} holding months")

def membership(members):
    return pd.DataFrame([ret.columns.isin(list(members(m))) for m in ret.index],
                        index=ret.index, columns=ret.columns)

masks = {"Point-in-time rosters": membership(lambda m: pit[m]),
         "Today's roster": membership(lambda m: today)}

for name, mask in masks.items():
    held = ret.where(mask)
    r = held.mean(axis=1)  # equal weight across the members with a return that month
    wealth = pd.concat([pd.Series([1.0], index=[ret.index[0] - 1]), (1 + r).cumprod()])
    dd = wealth / wealth.cummax() - 1
    trough = dd.idxmin()
    peak = wealth[:trough].idxmax()
    back = wealth[trough:][wealth[trough:] >= wealth[peak]].index[0]
    n = held.notna().sum(axis=1)
    print(f"{name}: {n.iloc[0]} names in Jan 2000, {n.iloc[-1]} in Dec 2024")
    print(f"  return {wealth.iloc[-1] ** (12 / len(r)) - 1:.2%} a year, volatility {r.std() * 12 ** 0.5:.2%}, "
          f"Sharpe {r.mean() * 12 / (r.std() * 12 ** 0.5):.2f} (risk-free rate set to zero)")
    print(f"  max drawdown {dd.min():.1%}: peak {peak}, trough {trough}, back to the peak {back}")
    print(f"  deepest drawdown 2000-2002 {dd['2000-01':'2002-12'].min():.1%}, "
          f"2007-2009 {dd['2007-01':'2009-12'].min():.1%}; worst month {r.min():.1%} ({r.idxmin()})")
    # Each company's own path over the months this book held it
    path = {c: np.r_[1.0, (1 + held[c].dropna()).cumprod()] for c in held.columns[held.notna().any()]}
    worst = pd.Series({c: (w / np.maximum.accumulate(w)).min() - 1 for c, w in path.items()})
    end = pd.Series({c: w[-1] / w.max() - 1 for c, w in path.items()})
    print(f"  companies held {len(path)}: fell 80%+ from a peak while held {(worst <= -0.8).mean():.1%}, "
          f"still 80%+ below it in the last month held {(end <= -0.8).mean():.1%} ({(end <= -0.8).sum()})")
Full script with formatting and visualisation: survivorship-bias-drawdown-risk-sp500-python.py
Output
300 monthly rosters, 1100 securities, 300 holding months
Point-in-time rosters: 499 names in Jan 2000, 503 in Dec 2024
  return 9.79% a year, volatility 17.69%, Sharpe 0.62 (risk-free rate set to zero)
  max drawdown -55.8%: peak 2007-05, trough 2009-02, back to the peak 2011-01
  deepest drawdown 2000-2002 -30.6%, 2007-2009 -55.8%; worst month -20.9% (2008-10)
  companies held 1063: fell 80%+ from a peak while held 23.9%, still 80%+ below it in the last month held 11.0% (117)
Today's roster: 336 names in Jan 2000, 497 in Dec 2024
  return 16.78% a year, volatility 16.77%, Sharpe 1.01 (risk-free rate set to zero)
  max drawdown -47.2%: peak 2007-10, trough 2009-02, back to the peak 2010-03
  deepest drawdown 2000-2002 -23.2%, 2007-2009 -47.2%; worst month -19.2% (2008-10)
  companies held 497: fell 80%+ from a peak while held 23.9%, still 80%+ below it in the last month held 0.8% (4)
How the two books part company in a crash
The survivor book’s maximum drawdown is 8.6 percentage points shallower, -47.2% against -55.8%, and shorter. The point-in-time book peaked in May 2007 and needed 44 months to regain that level; the survivor book peaked in October 2007 and was back 29 months later. The 2000-2002 bear market shows a smaller gap, -30.6% against -23.2%.
Volatility differs by less than a point a year, and both worst months fall in October 2008, at -20.9% and -19.2%. The books share many holdings, so ordinary swings match; they separate when companies collapse and leave the index.
The last line of each block explains it. In both books 23.9% of the companies held fell 80% or more from a peak while held, so the companies on today’s roster crashed about as often as those on the old rosters. Recovery is the difference: 4 of 497 survivor-book companies (0.8%) were still 80% or more below their peak in their last month held, against 117 of 1,063 (11.0%) in the point-in-time book, Lehman Brothers and WorldCom among them. A roster chosen today keeps the crashes that recovered and drops nearly all of those that did not.
The Sharpe ratio rises from 0.62 to 1.01 on today’s roster, mostly through return, 16.78% against 9.79% a year. Adding the exit values recorded for delisted securities moves the maximum drawdown by less than 0.1 point; capping monthly gains at +100% deepens the point-in-time drawdown by 0.2 and leaves the survivor book’s unchanged.
Setting drawdown limits from point-in-time rosters
A drawdown limit calibrated on a survivor backtest is set too loose. Expecting a worst case near 47% and a recovery inside two and a half years, an equal-weight large-cap book would have met 56% and more than three and a half years under water; leverage and stop-loss levels set from the shallower figure inherit the error.
Build the universe from the roster in force on each rebalance date and carry each holding until it leaves, so losses that ended in removal stay in the record. The historical S&P 500 constituents lookup shows the roster on any date. The explainer on survivorship bias in backtesting covers why the error arises, an annually rebalanced point-in-time comparison applies the roster test to returns, and a study of one-for-one S&P 500 replacements follows removed stocks after they leave.
Built with xfinlink — free financial data API for Python.