
Spin-offs that joined the S&P 500 and were not dropped within days kept roughly level with the market. From their first close as members, the 75 spin-off additions of 1993-2021 led SPY by a median 3.6 percentage points of total return over 36 months, with 53% ahead, a lead statistically indistinguishable from zero (mean t = 1.30). Counting only the 25 still in the index at the end of 2024 lifts the median lead to 16.6 points, though their gap over the 50 that left is not significant. The 17 spin-offs S&P added and dropped within days, all in 2015-2020, led SPY by a median 22.2 points after a year and trailed by 19.3 after three, neither figure significant.
Do spin-offs beat the market after they join the S&P 500?
A spin-off is a business a listed company separates by handing its shares to the parent’s shareholders. Large ones often enter the S&P 500 on their first day of regular-way trading.
For spin-offs going ex-distribution on or after 1 October 2015, S&P Dow Jones Indices adds the new company at a zero price after the prior day’s close and, if it is ineligible, removes it on its first day of regular-way trading at that day’s closing price (announcement of 14 September 2015). The additions log therefore holds kept spin-offs and spin-offs placed for a day or so. The question is how the kept ones did, on the dated record and on a later member list.
Following 92 spin-off additions from their first close as members
- Additions: first entries in
xfl.index_events("sp500")effective 1 February 1993 to 31 December 2021, without second share classes or returning securities; the index events reference documents the call, and the historical S&P 500 constituents lookup shows the same history. SPY began trading on 29 January 1993; the end date leaves 36 months before 2025. - Spin-offs: the classification from the study of how long companies trade before joining the S&P 500. An entrant with under 0.1 years of trading is a spin-off unless classed by hand as a carve-out IPO or a merger or reorganisation security; the hand list adds 11 spin-offs that joined later but within five years of their first trading day, such as Lehman Brothers in 1998. Dell’s class V tracking stock, issued in the EMC merger, is set aside.
- Placements: spin-offs with stays under 30 days form a separate group.
- Returns: compound daily total return (price plus dividends and distributions) from the first close on or after the effective date over 252, 504 and 756 trading days, minus SPY’s over the same days, holding through any later removal. Garrett Motion’s over-the-counter stretch of 2020-2021 runs from its last NYSE close to its first Nasdaq close.
- Exits: eight kept spin-offs stopped trading within 36 months, seven with a merger recorded as the exit. From the last close the money follows SPY.
- Survivor version: kept spin-offs whose membership is still running on the end-2024 roster,
xfl.index("sp500", as_of="2024-12-31").
Code
import warnings

import numpy as np
import pandas as pd
import xfinlink as xfl

xfl.set_api_key("YOUR_API_KEY")  # free at https://xfinlink.com/signup
warnings.filterwarnings("ignore", message="xfinlink: index_events")  # the loop below pages on purpose

START, END, LAST_DAY = "1993-02-01", "2021-12-31", "2024-12-31"  # SPY trades from 29 January 1993
HORIZONS = {"12m": 252, "24m": 504, "36m": 756}                  # trading days

# Route classification from https://xfinlink.com/blog/how-long-after-ipo-sp500-python
# Default: a first entry with under 0.1 years of trading is a spin-off. Hand overrides by ticker:year.
SECOND_CLASS = {10003590, 10032892, 10006698, 10003102, 10030753, 10004763, 10029970}
ROUTE = {
    "carve-out IPO": """SFR:1990 KRB:1992 DWD:1993 ATI:1994 FDC:1994 GLD:1994 ALL:1995 CSE:1996
        LU:1996 UPR:1996 GDT:1996 AFS:1998 COF:1998 DPH:1999 COC:1999 TSG:2000 A:2000 CVG:2000
        CIT:2000 PALM:2000 MIR:2001 PBG:2001 MON:2002 TAPB:2002 COH:2004 CIT:2004 FSLB:2004
        GNW:2005 AIZ:2007 MJN:2009 ZTS:2013 SYF:2015 CFG:2016 KVUE:2023""",
    "spin-off": """AGN:1992 LEH:1998 NCR:2000 CNXT:2000 RJR:2002 EXPE:2007 DPS:2008 DISCA:2010
        MNK:2014 FBHS:2016 KEYS:2018 LW:2018 SNDK:2025""",
    "other": "FRE:1992 VIA:1994 NDAQ:2008 TWC:2009 DVMT:2016",  # DVMT: tracking stock issued in the EMC merger
    "reorganisation": """CVN:1990 X:1991 TMC:1995 FCX:1995 UMG:1995 PNU:1995 FD:1995 GRA:1996
        ROK:1996 TEN:1996 SEE:1998 MAR:1998 UMG:1998 SRE:1998 EDS:1998 PCS:1998 MCK:1999 WLP:1999
        DVN:2000 DYN:2000 AET:2000 FLR:2000 XL:2001 CMCSA:2002 NWSA:2004 SHLD:2005 HOT:2006
        DTV:2006 NYX:2007 IVZ:2008 ESV:2012 LYB:2012 PNR:2012 KHC:2015 FTI:2017 DWDP:2017
        LIN:2018 AMCR:2019 VTRS:2020 WBD:2022 KDP:2022 SW:2024 TPL:2024 EXE:2025 PSKY:2025 CRH:2025""",
}
ROUTE_OF = {k: r for r, keys in ROUTE.items() for k in keys.split()}


def events(kind):
    pages = [xfl.index_events("sp500", event_type=kind, start="1925-12-31")]
    while len(pages[-1]) == 1000:  # one call returns at most 1,000 rows
        pages.append(xfl.index_events("sp500", event_type=kind, start="1925-12-31", offset=1000 * len(pages)))
    return pd.concat(pages, ignore_index=True).dropna(subset=["entity_id"]).astype({"entity_id": int})


def bars(ids, start, end, interval):
    fields = ["close"] if interval == "1w" else ["close", "return_daily"]
    return pd.concat([xfl.prices(entity_id=ids[i:i + 150], start=start, end=end, interval=interval,
                                 fields=fields, max_rows=400_000) for i in range(0, len(ids), 150)])


adds, rems = events("added"), events("removed")

# A stay under 30 days is a placement: S&P adds a member's spin-off and drops it when it does not fit
adds["last_day"] = [rems.loc[(rems["entity_id"] == r.entity_id) & (rems["effective_date"] >= r.effective_date),
                             "effective_date"].min() for r in adds.itertuples()]
adds["placement"] = (pd.to_datetime(adds["last_day"]) - pd.to_datetime(adds["effective_date"])).dt.days < 30
placement_exits = set(zip(adds.loc[adds["placement"], "entity_id"], adds.loc[adds["placement"], "last_day"]))
real_adds = adds[~adds["placement"]]
real_exits = rems[[(e, d) not in placement_exits for e, d in zip(rems["entity_id"], rems["effective_date"])]]
w = adds[adds["effective_date"].between(START, END) & ~adds["entity_id"].isin(SECOND_CLASS)].copy()
w["returning"] = [((real_adds["entity_id"] == r.entity_id) & (real_adds["effective_date"] < r.effective_date)).any()
                  or ((real_exits["entity_id"] == r.entity_id) & (real_exits["effective_date"] < r.effective_date)).any()
                  for r in w.itertuples()]
w = w[w["placement"] | ~w["returning"]]                   # first entries, plus placements
w["year"] = w["effective_date"].str[:4].astype(int)
w["key"] = w["ticker"] + ":" + w["year"].astype(str)      # ticker in force at the addition

# Screen on weekly bars, then date the first trading day of each candidate on daily bars
first_week = {}
for y, g in w.groupby("year"):
    wk = bars(sorted(set(g["entity_id"])), f"{y - 1}-10-23", f"{y}-12-31", "1w")
    first_week.update(wk.dropna(subset=["close"]).groupby("entity_id")["date"].min())
w["age_wk"] = (pd.to_datetime(w["effective_date"]) - w["entity_id"].map(first_week)).dt.days
cand = w[(w["age_wk"] < 60) | w["key"].isin(ROUTE_OF)]
daily = pd.concat([bars(sorted(set(g["entity_id"])), f"{y - 1}-10-23", min(f"{y + 3}-12-31", LAST_DAY), "1d")
                   for y, g in cand.groupby("year")]).drop_duplicates(["entity_id", "date"])
daily = daily.dropna(subset=["close"]).sort_values(["entity_id", "date"])
gap = daily.groupby("entity_id")["close"].pct_change()  # a long run with no close leaves return_daily null: bridge it
daily["return_daily"] = daily["return_daily"].fillna(gap)
first_bar = daily.groupby("entity_id")["date"].min()
cand = cand.assign(years=((pd.to_datetime(cand["effective_date"]) - cand["entity_id"].map(first_bar)).dt.days / 365.25).clip(lower=0))
cand["route"] = [ROUTE_OF.get(k, "spin-off" if y < 0.1 else "older listing") for k, y in zip(cand["key"], cand["years"])]
spin = cand[cand["route"] == "spin-off"].copy()
spin["group"] = np.where(spin["placement"], "placed", "kept")

spy = xfl.prices("SPY", start="1993-01-01", end=LAST_DAY, fields=["return_daily"]).set_index("date")["return_daily"].fillna(0.0)
cal = spy.index
end24 = xfl.index("sp500", as_of="2024-12-31").dropna(subset=["entity_id"])
still_in = set(zip(end24["entity_id"].astype(int), end24["added_date"].astype(str).str[:10]))  # same membership spell at end-2024

rows = []
for r in spin.itertuples():
    s = daily[daily["entity_id"] == r.entity_id].set_index("date")
    t0 = s.index[s.index >= r.effective_date].min()    # first close as a member (or first bar if later)
    k0, last = cal.get_loc(t0), s.index.max()
    row = {"ticker": r.ticker, "effective_date": r.effective_date, "group": r.group, "last_bar": last.date(),
           "survivor": (r.entity_id, r.effective_date) in still_in}
    for h, n in HORIZONS.items():
        days = cal[k0 + 1:k0 + n + 1]
        alive = days <= last
        stock = s["return_daily"].reindex(days).fillna(0.0).where(alive, spy.reindex(days))  # after the last close: SPY
        row[h] = np.prod(1 + stock) - np.prod(1 + spy.reindex(days))                         # total return minus SPY's
        row[h + "_stopped"] = not alive.all()
    rows.append(row)
res = pd.DataFrame(rows)
kept, placed = res[res["group"] == "kept"], res[res["group"] == "placed"]

for name, x in [("Kept, point-in-time", kept), ("Kept, still in the index at end-2024", kept[kept["survivor"]]),
                ("Kept, no longer in the index at end-2024", kept[~kept["survivor"]]), ("Placed and removed within days", placed)]:
    print(name, len(x), *[f"{h} median {x[h].median():+.1%} beat {(x[h] > 0).mean():.0%}" for h in HORIZONS])
Full script with formatting and visualisation: sp500-spin-offs-after-joining-python.py
Output
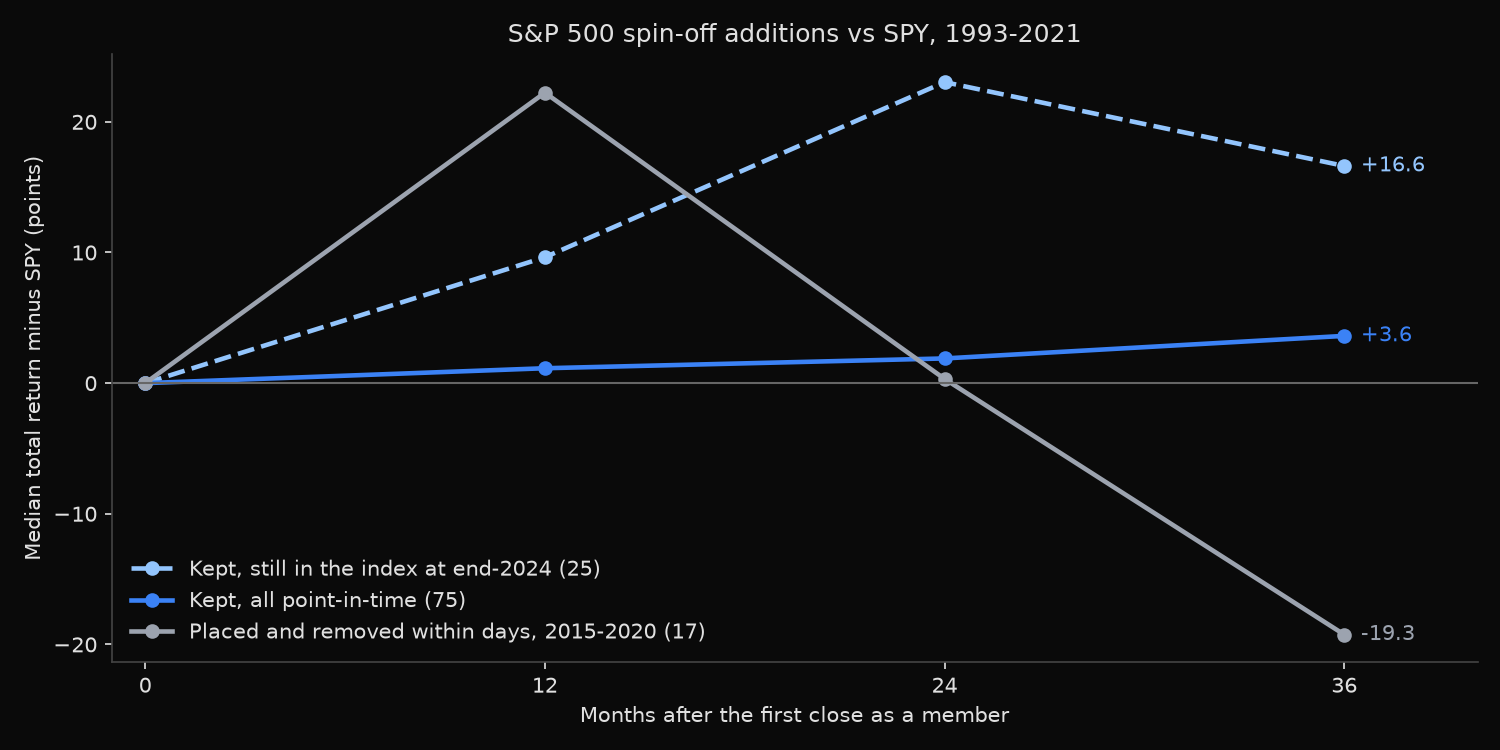
Spin-off additions effective 1993-02-01 to 2021-12-31: 92 (75 kept, 17 placed and removed within days)
  joined after their first month of trading: 11; first bar after the effective date: 3
  kept spin-offs whose shares stopped trading within 36 months: 8; still in the index at end-2024 (same membership): 25

Total return minus SPY's from the first close as a member (percentage points)
                                                          12 months                    24 months                    36 months
                                               n   median    mean beat     t    median    mean beat     t    median    mean beat     t
Kept, point-in-time                           75    +1.1%   +2.6%  52% +0.68     +1.9%   +7.0%  52% +1.18     +3.6%  +10.5%  53% +1.30
Kept, still in the index at end-2024 only     25    +9.6%  +10.4%  60% +1.51    +23.0%  +17.5%  60% +1.84    +16.6%  +18.1%  64% +1.34
Kept, no longer in the index at end-2024      50    -1.5%   -1.3%  48% -0.30     -2.0%   +1.8%  48% +0.24     -0.5%   +6.7%  48% +0.66
Placed and removed within days                17   +22.2%  +19.6%  65% +1.20     +0.3%  +10.6%  53% +0.53    -19.3%   -4.6%  41% -0.19
  12m: survivors minus the rest, mean gap +11.7% (Welch t = +1.43, p = 0.16)
  24m: survivors minus the rest, mean gap +15.7% (Welch t = +1.30, p = 0.20)
  36m: survivors minus the rest, mean gap +11.3% (Welch t = +0.67, p = 0.50)

Kept spin-offs by period of addition, 36 months
  1993-2001  n=22  median -12.5%  beat SPY 41%  still in the index 5
  2002-2011  n=27  median +10.2%  beat SPY 67%  still in the index 6
  2012-2021  n=26  median  -8.1%  beat SPY 50%  still in the index 14

Placed spin-offs, 2015-2020:
effective_date ticker    12m    36m
    2015-11-10   FCPT  0.408  0.945
    2016-05-16   NGVT  0.991  1.933
    2016-10-03   ASIX  1.317 -0.014
    2016-10-03    VSM  0.222  0.478
    2016-10-31   ADNT  0.640 -1.024
    2016-11-01     AA  0.829 -0.547
    2016-11-01    QCP -0.168  0.004
    2016-11-01   YUMC  0.278  0.099
    2016-11-10     LW  0.529  1.271
    2017-02-02   BIVV  1.079  1.396
    2018-05-01    NVT  0.115 -0.193
    2018-05-09    APY -0.164 -1.036
    2018-10-01    GTX -0.491 -1.174
    2018-10-29   REZI -0.817 -0.881
    2019-02-08   CVET -0.944 -1.313
    2019-05-23    KTB -0.687 -0.392
    2020-12-15   AIRC  0.191 -0.327

Kept spin-offs, best and worst 36 months:
effective_date ticker  survivor    36m
    2001-08-07    ZMH      True  1.455
    1998-01-12    LEH     False  1.640
    1997-06-11    PVN     False  2.708
    1996-05-31    TUP     False -1.509
    2012-01-03    WPX     False -1.060
    1998-04-01    GRA     False -0.988
A survivor list carries a lead the full sample lacks
On the dated record, joining the S&P 500 as a spin-off said little about the next three years. Median gaps of 1.1, 1.9 and 3.6 points at 12, 24 and 36 months, with 52% to 53% ahead, are near a coin toss. The 36-month mean of 10.5 points rests on a few large winners, Providian Financial (+271 points) and Lehman Brothers (+164), against losers such as Tupperware (-151).
Fifty of the 75 had left by the end of 2024, and their 36-month median is -0.5 points. The 25 that remain show +16.6, with 64% ahead. The gap between the groups is not significant (Welch p from 0.16 to 0.50), so the sample does not prove the eventual survivors were identifiable at the time. It shows something narrower: a spin-off list drawn from later members reports a lead more than four times the one the index’s own spin-offs delivered. Survivors also tilt towards recent years, 14 of the 26 additions from 2012-2021 against 5 of 22 from 1993-2001.
Being dropped at once did not mark the weaker names early: eleven of the 17 beat SPY over their first year, led by AdvanSix (+132 points). By 36 months the median stood at -19.3, and Garrett Motion, Covetrus, Apergy and Adient each trailed by more than 100 points. With 17 names, neither horizon is significant (mean t = 1.20 and -0.19).
Using spin-off additions in a screen or a backtest
Index entry is not a buy signal for a spin-off: the median gap to SPY stayed under four points at every horizon, and its sign changed across 1993-2001 (-12.5), 2002-2011 (+10.2) and 2012-2021 (-8.1).
For research, build the sample from the dated additions, hold each name through takeovers and demotions, and keep zero-price placements apart, since from late 2015 they enter the log too. A spin-off sample drawn from the end-2024 roster adds 13 points to the 36-month median, although survivors and leavers do not differ significantly. An event study of S&P 500 additions examines prices in the days around the effective date.
Built with xfinlink — free financial data API for Python.