
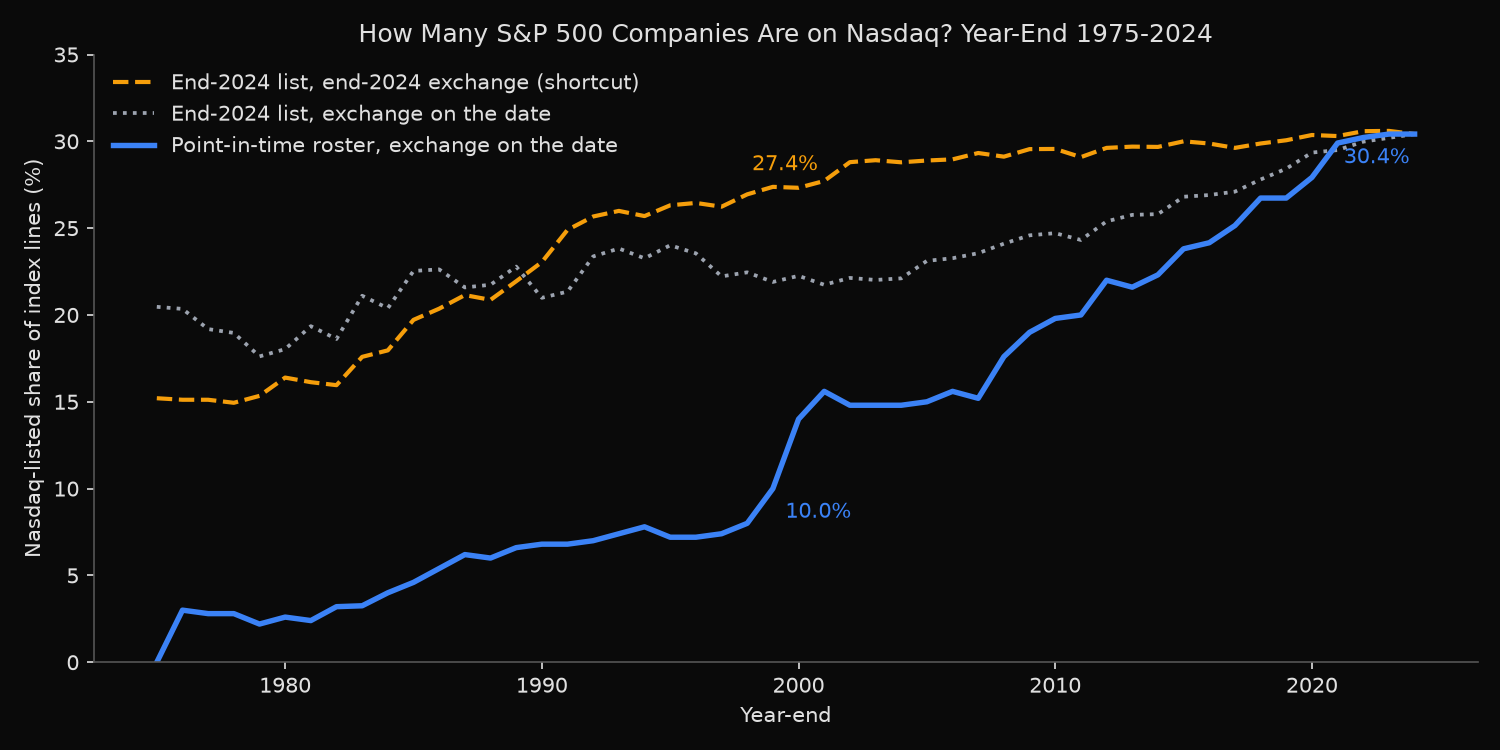
At the end of 2024, 153 of the S&P 500’s 503 index lines (one line per share class) were listed on Nasdaq, 30.4%, against 10.0% at the end of 1999 and none at the end of 1975. A history built from the end-2024 list and its end-2024 exchanges puts 1999 at 27.4%, 17.4 points too high, because it counts companies that had not yet joined the index, drops members that later left, and labels the rest with exchanges some of them did not yet use.
Where are S&P 500 companies listed, and since when?
An S&P 500 member can be listed on the New York Stock Exchange (NYSE), on Nasdaq or elsewhere, and companies move: Texas Instruments went from the NYSE to Nasdaq at the start of 2012, Oracle left Nasdaq for the NYSE in July 2013, and PepsiCo moved to Nasdaq in December 2017.
The quick answer uses a current constituents file and its exchange column. For a past date that fails twice: it gets the membership wrong, counting companies that joined later and omitting members that have since left, and it shows today’s listing. This post measures both errors on year-end rosters from 1975 to 2024.
Rebuilding 50 year-end rosters with each member’s exchange on the date
- Take the roster on the last trading day of each year, 1962 to 2024, with
xfl.index("sp500", as_of=...)(the same dated lists as the historical S&P 500 constituents lookup). Every year-end roster through 1975 is entirely NYSE-listed, so the comparison starts at the end of 1975. - Read each member’s exchange on that day from yearly price bars by
entity_id. On a yearly barexchange_codeis the exchange on the bucket’s last trading day, whiledateis its first, as the price fields reference defines. Of 31,545 member lines, 31,537 carry an exchange; the other eight are December 1983 additions whose price history starts in early 1984, left out of that year’s count. - Count index lines, one per share class. Merging dual-class lines by company moves the end-2024 share from 30.4% to 30.0%.
- Build the shortcut: each security on the end-2024 list that traded in a given year, labelled with its end-2024 exchange. Relabelling the same names with their exchange on the date splits its error into membership and exchange-label parts.
- Split each year’s change in the Nasdaq count into additions, removals and exchange moves.
Code
import pandas as pd
import xfinlink as xfl

xfl.set_api_key("YOUR_API_KEY")  # free at https://xfinlink.com/signup

# Last trading day of each year (IBM traded every session), then that day's roster
cal = xfl.prices(entity_id=10001962, start="1962-01-01", end="2024-12-31",
                 fields=["close"], max_rows=100_000)
days = cal.groupby(cal["date"].dt.year)["date"].max()
ros = pd.concat([xfl.index("sp500", as_of=d.date().isoformat()).assign(year=d.year)
                 for d in days])

# Yearly bars: exchange_code is the listing exchange on the year's last trading day
ids = sorted(set(ros["entity_id"]))
px = pd.concat([xfl.prices(entity_id=ids[i:i + 150], start="1962-01-01", end="2024-12-31",
                           interval="1y", fields=["exchange_code"], max_rows=500_000)
                for i in range(0, len(ids), 150)])
px["year"] = px["date"].dt.year
ven = px.set_index(["entity_id", "year"])["exchange_code"]
ros["venue"] = ven.reindex(pd.MultiIndex.from_frame(ros[["entity_id", "year"]])).values

# (a) point in time: each year's roster, each member's exchange on that date
nasdaq_pct = lambda s: (s == "NASDAQ").mean() * 100
pit = ros.dropna(subset=["venue"]).groupby("year")["venue"].apply(nasdaq_pct)

# (b) shortcut: the end-2024 list, every name trading that year, end-2024 exchange
last = ros[ros["year"] == 2024].set_index("entity_id")["venue"]
mine = px[px["entity_id"].isin(last.index)]
on_date = mine.groupby("year")["exchange_code"].apply(nasdaq_pct)
shortcut = mine.groupby("year")["entity_id"].apply(lambda e: nasdaq_pct(last.reindex(e)))

# Members whose exchange changed between two consecutive year-end rosters
r = ros.sort_values(["entity_id", "year"])
prev = r.groupby("entity_id")[["year", "venue"]].shift()
moved = r[(prev["year"] == r["year"] - 1) & prev["venue"].notna()
          & r["venue"].notna() & (prev["venue"] != r["venue"])]

print(pd.DataFrame({"point_in_time": pit, "list_on_date": on_date,
                    "shortcut": shortcut}).loc[1975:].round(1))
print(len(moved), moved.assign(prev=prev["venue"]).groupby(["prev", "venue"]).size())
Full script with formatting and visualisation: sp500-companies-nasdaq-vs-nyse-history-python.py
Output
Member lines 1962-2024: 31,545; with a listing exchange on the roster date: 31,537
Lines without one, by year: {1983: 8}
Point-in-time Nasdaq lines before 1976: 0 of 500 in 1975

Nasdaq share of S&P 500 lines at year-end (%)
year nasdaq lines point-in-time | end-2024 list: names exchange on date end-2024 exchange
1975      0   500           0.0 |                  171             20.5              15.2
1980     13   500           2.6 |                  183             18.0              16.4
1985     23   500           4.6 |                  213             22.5              19.7
1990     34   500           6.8 |                  243             21.0              23.0
1995     36   500           7.2 |                  304             24.0              26.3
1998     40   500           8.0 |                  334             22.5              26.9
1999     50   500          10.0 |                  347             21.9              27.4
2000     70   500          14.0 |                  355             22.3              27.3
2001     78   500          15.6 |                  368             21.7              27.7
2005     75   500          15.0 |                  398             23.1              28.9
2008     88   500          17.6 |                  419             24.1              29.1
2010     99   500          19.8 |                  433             24.7              29.6
2015    120   504          23.8 |                  470             26.8              30.0
2020    141   505          27.9 |                  494             29.4              30.4
2024    153   503          30.4 |                  503             30.4              30.4

Gap between the shortcut and the point-in-time share (points)
  1990: total +16.2 = membership +14.2 + exchange label +2.1
  1999: total +17.4 = membership +11.9 + exchange label +5.5
  2010: total +9.8 = membership +4.9 + exchange label +4.8
  1999: shortcut Nasdaq basket 95 names; Nasdaq-listed members that year 50; in both 20
  2000: shortcut Nasdaq basket 97 names; Nasdaq-listed members that year 70; in both 22
  Nasdaq lines at end-2000 not on the end-2024 list: 46 of 70, e.g. SUNW, WCOM, YHOO, PSFT, PALM
  largest gap: 1996 (19.3 points); mean 1975-2023: 12.1

Where the point-in-time Nasdaq count came from
  1976-1997:   0 ->  37  added +81  removed -24  moved in +0   moved out -20
  1998-2001:  37 ->  78  added +57  removed -9   moved in +0   moved out -7
  2002-2007:  78 ->  76  added +28  removed -30  moved in +3   moved out -3
  2008-2024:  76 -> 153  added +126 removed -83  moved in +44  moved out -10

Exchange moves by members between consecutive year-ends 1975-2024: 98
from    to
AMEX    NYSE      11
NASDAQ  BATS       1
        NYSE      39
NYSE    NASDAQ    47
period     from    to
1976-2004  AMEX    NYSE      10
           NASDAQ  NYSE      29
2005-2024  AMEX    NYSE       1
           NASDAQ  NYSE      10
           NYSE    NASDAQ    47
 year ticker                  name   from     to    period
 2012    TXN TEXAS INSTRUMENTS INC   NYSE NASDAQ 2005-2024
 2013   ORCL           ORACLE CORP NASDAQ   NYSE 2005-2024
 2017    PEP           PEPSICO INC   NYSE NASDAQ 2005-2024

Company-level check (dual-class lines merged by company name)
  1999: 50 of 499 companies on Nasdaq, 10.0%
  2024: 150 of 500 companies on Nasdaq, 30.0%
  2024 lines by exchange: {'NYSE': 349, 'NASDAQ': 153, 'BATS': 1}
Membership explains most of the gap; exchange moves explain the rest
On point-in-time rosters the first Nasdaq-listed members arrive on 1 July 1976, mostly insurers, banks, brewers and truckers, with Intel added that December. The share reached 8.0% by 1998, nearly doubled to 15.6% by 2001 as 57 Nasdaq-listed names joined in four years, held near 15% until 2007, then rose to 30.4%.
The shortcut is much flatter: 15.2% for 1975, when no member was Nasdaq-listed, then 25% to 31% from 1992 on. Its error peaks at 19.3 points in 1996 and averages 12.1 points over 1975-2023.
Membership supplies 11.9 of the 17.4 points in 1999. The shortcut’s Nasdaq basket for that year holds 95 names; only 20 were Nasdaq-listed members then, out of 50. Most of the other 75 had not yet joined the index. The basket also misses members that later left: 46 of the 70 Nasdaq lines at the end of 2000 are absent from the end-2024 list, among them Sun Microsystems, WorldCom, Yahoo, PeopleSoft and Palm. The other 5.5 points are exchange labels, an effect that ran the other way before 1990, when several of the end-2024 list’s NYSE members were still on Nasdaq.
Members moved exchange 98 times between year-ends. All 39 moves before 2005 went to the NYSE (29 from Nasdaq, 10 from the American Stock Exchange); from 2005, 47 of 59 went from the NYSE to Nasdaq. Between the end of 2007 and the end of 2024 the Nasdaq count grew by 77 lines, 43 from additions net of removals and 34 from net moves.
Dating the exchange in a historical stock universe
An exchange filter on a past universe needs two dated inputs: the roster and each member’s listing that day. A “Nasdaq-listed S&P 500” basket for 1999 built from the end-2024 list holds 95 names, 75 of which were not Nasdaq-listed members then, and misses 30 of the 50 that were. Store the exchange as a dated field, not a fixed company attribute; PepsiCo’s 2017 move changed its venue without changing the company. The guide to S&P 500 additions and deletions explains how membership is rebuilt from dated changes, and a year-by-year study of the largest S&P 500 companies follows the roster’s make-up by size. At the end of 2024 the count stood at 153 lines on Nasdaq, 349 on the NYSE and one on BATS.
Built with xfinlink — free financial data API for Python.