
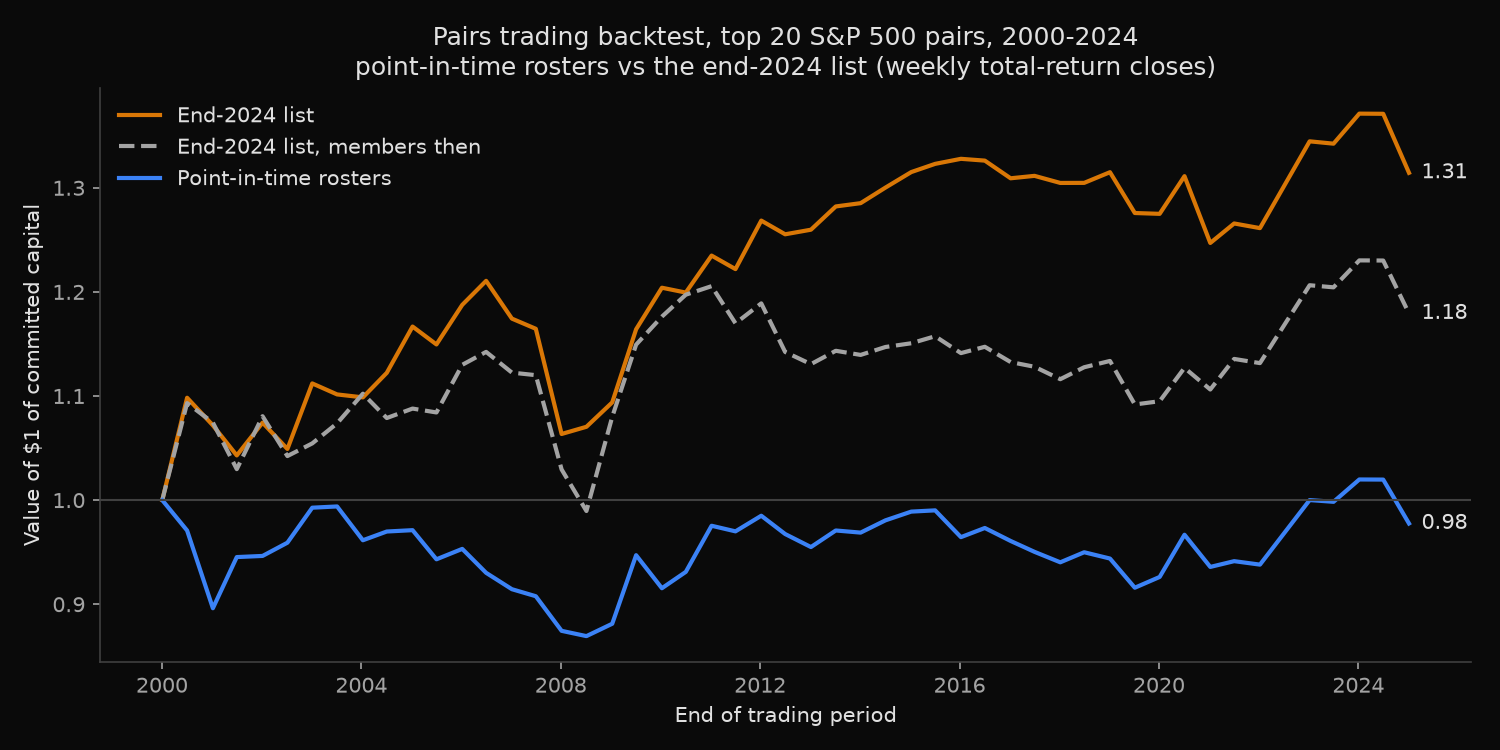
A distance-method pairs trading backtest on the S&P 500 rosters of the time earned nothing from 2000 to 2024: -0.01% per six-month period on committed capital, with 25 of 50 periods positive. On the end-2024 list the same rule earns 0.59% per period and turns $1 into $1.31 rather than $0.98, a gap short of statistical significance (t = -1.43). Takeovers touched only 15 of 917 traded pairs; the gap tracks which companies the survivor list holds and leaves out.
Where can survivorship bias enter a pairs trading backtest?
Pairs trading buys one stock and shorts another that has tracked it, betting the gap closes. Gatev, Goetzmann and Rouwenhorst (Review of Financial Studies, 2006) set out the distance method: match stocks by the smallest distance between normalised prices, open when the gap reaches two standard deviations, unwind on convergence. On daily data for 1962-2002 they reported average annualised excess returns of up to 11% for self-financing portfolios of pairs.
Survivorship bias, testing on the stocks that lasted rather than those available at the time, has two routes in. A survivor list holds no leg acquired or delisted mid-trade, the textbook way a pair splits for good, and it holds later joiners, picked with hindsight because they grew.
Fifty pair books drawn from the roster on each selection date
- Periods: 50 six-month trading windows starting each January and July, 2000 to 2024, each after 12 months of formation, on weekly total-return closes (price plus dividends).
- Point-in-time universe: the S&P 500 on the Friday before each trading period, from the historical S&P 500 constituents lookup, via the
as_ofcall in the index membership reference. Members need a return in every formation week; legs are followed byentity_id. - Survivor universe: the end-2024 roster with the same filter, 431 names a period on average against 499. A third version keeps only end-2024 names that were members at the time.
- Pairs: the 20 pairs with the smallest sum of squared deviations between normalised formation prices, excluding two share classes of one company.
- Trading: when the gap passes two formation standard deviations at a weekly close, go $1 long the lower stock and $1 short the higher; close when prices cross or at period end, reopening if the gap widens again. Committed capital averages all 20 pairs, unopened ones at zero; fully invested averages opened pairs. No trading costs.
- Exits: when a leg’s series ends inside the window, the pair closes at its last weekly close with the recorded delisting return (last close to exit value) applied. Every such leg had a recorded return.
The same survivor-list problem at a one-month horizon is the subject of a short-term reversal backtest on S&P 500 rosters.
Code
import numpy as np
import pandas as pd
import xfinlink as xfl

xfl.set_api_key("YOUR_API_KEY")  # free at https://xfinlink.com/signup

N_PAIRS, OPEN_SD = 20, 2.0
monday = lambda d: d + pd.Timedelta(days=(7 - d.weekday()) % 7)
starts = [monday(pd.Timestamp(f"{y}-{m:02d}-01")) for y in range(2000, 2025) for m in (1, 7)]
periods = [(monday(t - pd.DateOffset(months=12)), t, monday(t + pd.DateOffset(months=6))) for t in starts]

# The S&P 500 on the Friday before each trading period, and the end-2024 list
rosters = {t: xfl.index("sp500", as_of=(t - pd.Timedelta(days=3)).date().isoformat())
           .dropna(subset=["entity_id"])["entity_id"].astype(int).tolist() for _, t, _ in periods}
survivors = xfl.index("sp500", as_of="2024-12-31").dropna(subset=["entity_id"])["entity_id"].astype(int).tolist()

# Weekly total returns by entity_id, 1999-2024
ids = sorted(set().union(*rosters.values(), survivors))
px = pd.concat([xfl.prices(entity_id=ids[i:i + 150], start="1999-01-01", end="2024-12-31", interval="1w",
                           fields=["return_daily"], max_rows=400_000)
                for i in range(0, len(ids), 150)], ignore_index=True)
px["week"] = px["date"] - pd.to_timedelta(px["date"].dt.dayofweek, unit="D")
px = px.drop_duplicates(["entity_id", "week"])
last_bar = px.dropna(subset=["return_daily"]).groupby("entity_id")["week"].max()

# Exit records for series that end before the last week of 2024, one short request per exit year
ended = last_bar[last_bar < pd.Timestamp("2024-12-23")]
delist = {}
for y, grp in ended.groupby(ended.dt.year):
    g = grp.index.tolist()
    for i in range(0, len(g), 80):
        d = xfl.prices(entity_id=g[i:i + 80], start=f"{y}-01-01", end="2024-12-31",
                       interval="1w", fields=["return_daily"])
        delist.update({int(k): v for k, v in (d.attrs["meta"].get("delisting") or {}).items()})
ret = px.pivot(index="week", columns="entity_id", values="return_daily").sort_index()
company = px.groupby("entity_id")["entity_name"].last()

def trade_pair(a, b, sd, R):
    n = len(R)
    stop = {leg: int(np.searchsorted(R.index, last_bar[leg], side="right"))
            for leg in (a, b) if last_bar[leg] < R.index[-1]}      # leg stopped trading in the window
    end = min(stop.values(), default=n)
    pa = np.cumprod(1 + R[a].fillna(0).to_numpy()[:end])            # normalised total-return prices
    pb = np.cumprod(1 + R[b].fillna(0).to_numpy()[:end])
    s = pa - pb
    def close(k, final=False):
        la, lb = pa[k], pb[k]
        for leg in stop if final else ():
            d = delist.get(leg, {}).get("delisting_return")          # last close to exit value
            if stop[leg] == end and d is not None:
                la, lb = (la * (1 + d), lb) if leg == a else (la, lb * (1 + d))
        return pos * ((lb / pb[opened] - 1) - (la / pa[opened] - 1))  # pos=+1: short a, long b
    total, trades, pos, opened = 1.0, 0, 0, None
    for k in range(len(s)):
        if pos == 0 and abs(s[k]) > OPEN_SD * sd:
            pos, opened, trades = (1 if s[k] > 0 else -1), k, trades + 1
        elif pos != 0 and (np.sign(s[k]) != pos or s[k] == 0):          # prices crossed
            total *= 1 + close(k)
            pos = 0
    if pos != 0:
        total *= 1 + close(len(s) - 1, final=end < n)
    return total - 1, trades, end < n

def run(universe_of):
    per, pairs = [], []
    for f0, t0, t1 in periods:
        F, R = ret[(ret.index >= f0) & (ret.index < t0)], ret[(ret.index >= t0) & (ret.index < t1)]
        u = [e for e in universe_of(t0) if e in F.columns and F[e].notna().all()]
        P = np.cumprod(1 + F[u].to_numpy(), axis=0)                  # normalised formation prices
        sq = (P ** 2).sum(0)
        ssd = sq[:, None] + sq[None, :] - 2 * P.T @ P                 # sum of squared deviations
        names = company.reindex(u).to_numpy()
        ssd[np.triu_indices(len(u))] = np.inf
        ssd[names[:, None] == names[None, :]] = np.inf                # two share classes of one company
        top = list(zip(*np.unravel_index(np.argsort(ssd, axis=None)[:N_PAIRS], ssd.shape)))
        out = [trade_pair(u[i], u[j], (P[:, i] - P[:, j]).std(ddof=1), R) for i, j in top]
        pairs += [(t0, u[i], u[j], *o) for (i, j), o in zip(top, out)]
        per.append(np.mean([o[0] for o in out]))                     # committed capital: all 20 pairs
    return pd.Series(per), pd.DataFrame(pairs, columns=["t0", "a", "b", "ret", "trades", "stopped"])

for name, f in [("Point-in-time rosters", lambda t: rosters[t]), ("End-2024 list", lambda t: survivors),
                ("End-2024 list, members then", lambda t: [e for e in survivors if e in set(rosters[t])])]:
    cc, pairs = run(f)
    opened = pairs[pairs["trades"] > 0]
    print(name, f"{cc.mean():.2%}", f"t={cc.mean() / cc.std(ddof=1) * np.sqrt(len(cc)):.2f}",
          f"{(cc > 0).mean():.0%}", f"{np.prod(1 + cc):.2f}", f"{opened['stopped'].mean():.1%}")
Full script with formatting and visualisation: pairs-trading-survivorship-bias-python.py
Output
Securities priced: 1064; trading periods: 50, 2000-01-03 to 2024-12-31; top 20 pairs a period, open at 2 SD, weekly total-return closes
Pair return = long leg return minus short leg return, $1 a side; committed capital = mean over all 20 pairs, fully invested = mean over pairs that opened

                               names   6m cc     t   6m fi periods +  opened stopped leg
Point-in-time rosters            499  -0.01% -0.02   0.01%       50%   91.7%        1.6%
End-2024 list                    431   0.59%  1.39   0.63%       56%   92.2%        0.0%
End-2024 list, members then      323   0.38%  0.84   0.39%       54%   92.4%        0.0%

Point-in-time minus end-2024 list: -0.60% per 6 months (t = -1.43); minus members-then: -0.39% (t = -0.81)
Growth of $1 of committed capital over the 50 periods: Point-in-time rosters 0.98, End-2024 list 1.31, End-2024 list, members then 1.18
Entry one week after the signal: Point-in-time rosters -0.07%, End-2024 list 0.39%

Point-in-time book: 917 pairs opened, 15 with a leg that stopped trading in the window (14 open at the time)
  mean 6m return: those 15 pairs 2.74%, the other 902 -0.06%
  2000-01-03    NSP/CSR     CSR last week 2000-06-12  merger    exit  -0.06%  pair +6.01%
  2000-07-03    NSP/NCE     NCE last week 2000-08-14  merger    exit  +0.70%  pair -0.95%
  2000-07-03    UCM/PE      UCM last week 2000-10-16  merger    exit  +2.65%  pair +4.64%
  2001-01-01     UK/DOW      UK last week 2001-02-05  merger    exit  +4.16%  pair -6.96%
  2001-01-01     UK/PPG      UK last week 2001-02-05  merger    exit  +4.16%  pair +6.08%
  2002-01-07    WLL/JP      WLL last week 2002-03-11  merger    exit  +0.00%  pair +6.36%
  2007-07-02     MI/KSE     KSE last week 2007-08-20  merger    exit  +0.09%  pair +0.41%
  2007-07-02    KSE/K       KSE last week 2007-08-20  merger    exit  +0.09%  pair +0.87%
  2007-07-02    PNC/KSE     KSE last week 2007-08-20  merger    exit  +0.09%  pair +9.12%
  2008-01-07    HET/BUD     HET last week 2008-01-21  merger    exit  +0.61%  pair -0.61%
  2008-01-07    WPO/HET     HET last week 2008-01-21  merger    exit  +0.61%  pair -0.61%
  2012-07-02    PGN/DUK     PGN last week 2012-07-02  merger    exit  -1.65%  pair +1.65%
  2013-01-07    JNJ/HNZ     HNZ last week 2013-06-03  merger    exit  +0.01%  pair +12.21%
  2013-01-07    HNZ/CB      HNZ last week 2013-06-03  merger    exit  +0.01%  pair +3.32%
  2015-07-06    MTB/HCBK   HCBK last week 2015-10-26  merger    exit  -0.18%  pair -0.40%

Mean 6-month committed-capital return by sub-period (share of periods positive)
  Point-in-time rosters         2000-07 -0.79% (50%)  2008-15  0.65% (56%)  2016-24  0.10% (44%)
  End-2024 list                 2000-07  0.47% (44%)  2008-15  1.41% (81%)  2016-24 -0.03% (44%)
  End-2024 list, members then   2000-07  0.26% (50%)  2008-15  0.70% (62%)  2016-24  0.20% (50%)

End-2024 book: 284 of 1000 pairs have a leg not yet in the index at selection; mean 6m return 1.71% against 0.15% for the rest
Takeovers were rare; the gap sits in the universe
On the real rosters the rule has no edge: -0.01% per six months (t = -0.02), and -0.07% when entry waits a week after the signal. The 1962-2002 study used daily bars, a wider universe and an earlier era.
The end-2024 list reports 0.59% per period, about 1.2% a year. The 0.60-point difference has a t-statistic of -1.43, short of significance over 50 periods, yet it equals the survivor backtest’s entire return. It is widest in 2000-2007 (-0.79% against 0.47%), persists in 2008-2015, when 81% of survivor-list periods were positive against 56%, and reverses slightly in 2016-2024 (0.10% against -0.03%).
Only 15 of 917 opened pairs lost a leg during the window, all through mergers (exit returns -1.65% to +4.16%), and those pairs averaged +2.74% against -0.06%. In five, the two legs merged with each other, Union Carbide into Dow and Hudson City into M&T among them.
The universe split locates the difference. Keeping only end-2024 names that were members at the time gives 0.38%, so about two thirds of the point estimate comes from leaving out companies that later exited the index and one third from adding companies that joined later. In the end-2024 book, 284 of 1,000 pairs had a leg not yet in the index when chosen; those pairs averaged 1.71% a period against 0.15%.
Testing a pairs rule on the rosters it would have faced
A constituent list drawn today added about 0.6 points per six months to a distance-pairs backtest whose real-roster return was zero. Over 50 periods that gap falls short of significance, yet it is the whole of the apparent profit, before four trades per round trip and short-borrow fees.
Draw the universe from the roster on each selection date, follow legs by entity_id, and close a pair when a leg’s series ends, applying its delisting return. Screening out takeover candidates would not have helped here, since the 15 pairs that lost a leg did better than the rest. An analysis of stocks removed from the S&P 500 covers the companies a current list leaves out.
Built with xfinlink — free financial data API for Python.