
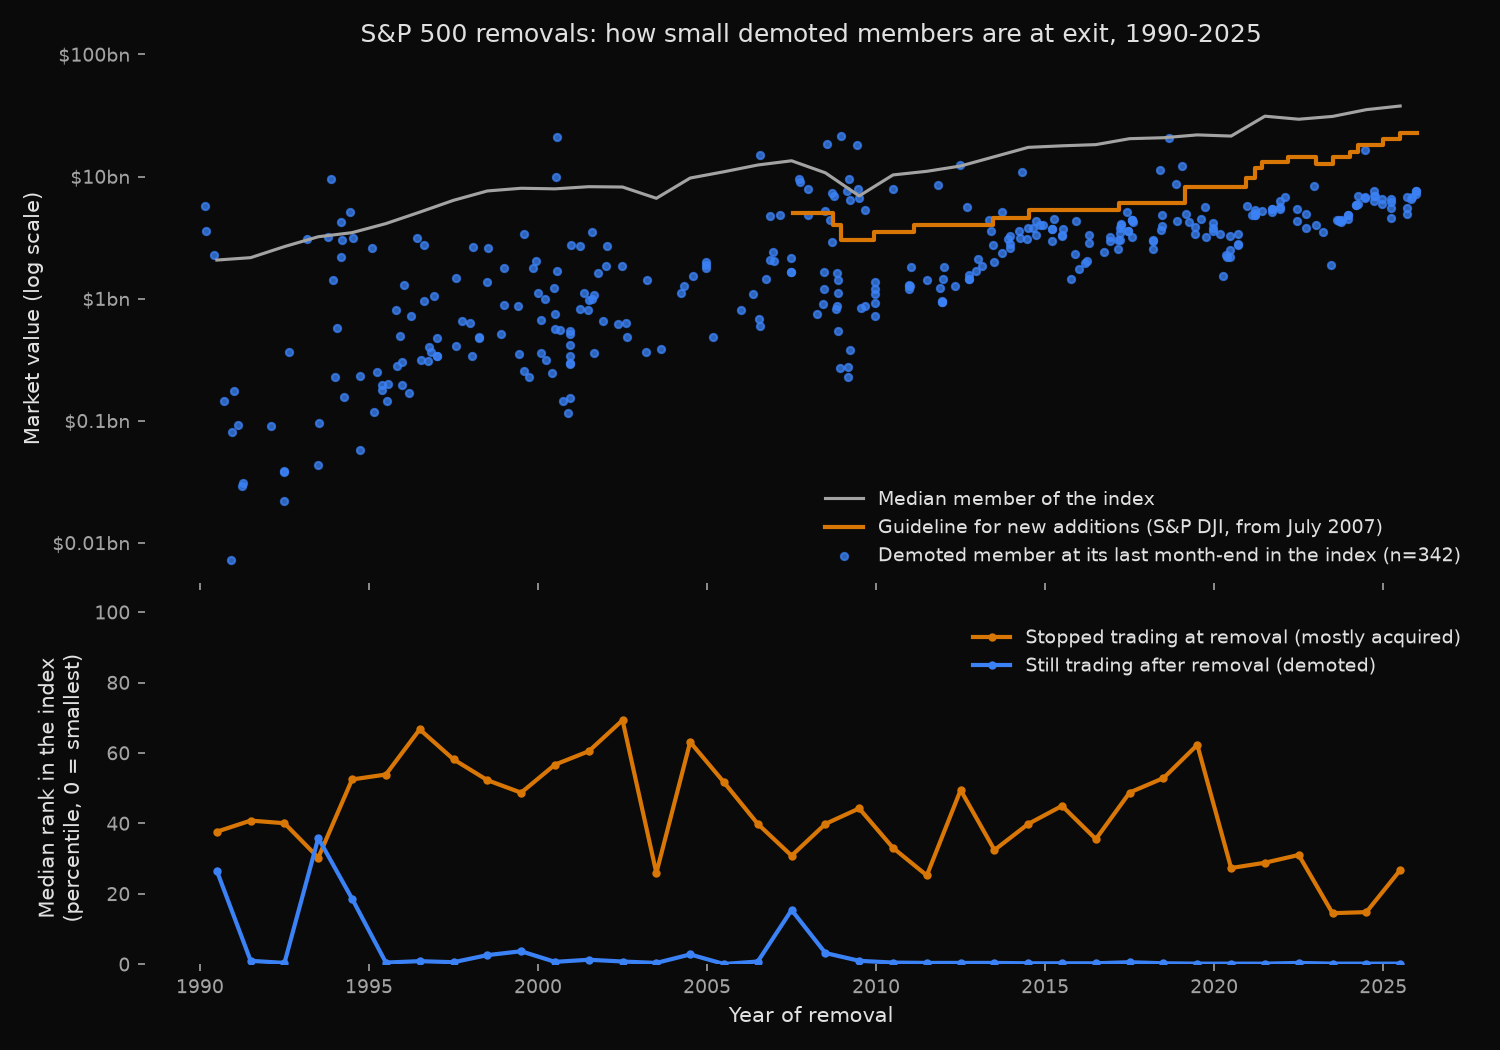
S&P 500 members that were demoted, removed while their shares went on trading, left from the very bottom of the index: in 2020-25 the median one ranked at the 0.2 percentile on its last month-end as a member, and all 65 were worth less than the guideline for new additions then in force, a median 34% of it. Acquired members left from a median 26th to 51st percentile, depending on the decade.
How small does a company get before it is removed from the S&P 500?
The S&P U.S. Indices methodology states that “the addition criteria are for addition to an index, not for continued membership”, so a member that appears to violate them “is not deleted unless ongoing conditions warrant an index change” (methodology, S&P Dow Jones Indices). Only new additions face a published floor: a company market cap of at least US$22.7 billion since 1 July 2025 (S&P Dow Jones Indices), with lower figures at earlier dates.
Today’s member list cannot show how far members fall before they go; it holds only 19 of the 342 demoted members measured here, each because it was added again more than a year later. The answer needs the companies that left and the rosters of their day, as kept in the historical S&P 500 constituents. A study of new additions’ size at entry covers the other end of a membership, and a post on stocks removed from the S&P 500 follows their returns before exit.
Ranking 852 removals against the roster of their day
- Take every removal effective 1990 to 2025 from
xfl.index_events("sp500")(index events reference): 852, share classes folded into their company. - Class each removal by its own price series: at most 5 trading days of prices after it (stopped trading, 446), at least 63 (still trading, 374), or in between (32). Members held under 30 days, the seven non-US companies removed under an index rule on 19 July 2002, and two removals without a month-end market value drop from the sample, leaving 342 demoted members.
- Rebuild each day’s roster from the 1979-12-31 roster and the event log; it equals
xfl.index("sp500", as_of=...)on four test dates. - Value every member at the last month-end on or before each removal, summing a company’s share classes that are index members (and Berkshire Hathaway’s class A shares). DISH Network’s figure covers its listed class A shares; with its unlisted class B shares it was worth about $3.4 billion, still the smallest member that day. The exit percentile is the share of other members smaller than the removed company; 0 is the smallest.
- Rank members that joined in 1980 or later at their first month-end too, and compare exits from July 2007 on with the guideline then in force (S&P Dow Jones Indices’ methodology and press releases).
Code
import numpy as np
import pandas as pd
import xfinlink as xfl

xfl.set_api_key("YOUR_API_KEY")  # free at https://xfinlink.com/signup

CLASS_OF = {10003590: 10030636, 10032892: 10031087, 10006698: 10006697, 10003102: 10003101,
            10030753: 10030752, 10004763: 10031256, 10029970: 10029932, 10006133: 10025221}

# Membership spells: the 1979-12-31 roster plus every later addition, closed by its removal
ev = pd.concat([xfl.index_events("sp500", offset=o) for o in range(0, 4000, 1000)], ignore_index=True)
ev["eff"] = pd.to_datetime(ev["effective_date"])
ev = ev.dropna(subset=["entity_id"]).astype({"entity_id": int})
r0 = xfl.index("sp500", as_of="1979-12-31")
OPEN = pd.Timestamp("2099-01-01")
spells = [(e, pd.Timestamp(a), pd.Timestamp(r) if pd.notna(r) else OPEN)
          for e, a, r in zip(r0["entity_id"], r0["added_date"], r0["removed_date"])]
rems = ev[ev["event_type"] == "removed"]
for a in ev[(ev["event_type"] == "added") & (ev["eff"] > "1979-12-31")].itertuples():
    out = rems.loc[(rems["entity_id"] == a.entity_id) & (rems["eff"] >= a.eff), "eff"]
    spells.append((a.entity_id, a.eff, out.min() if len(out) else OPEN))
sp = pd.DataFrame(spells, columns=["eid", "add", "rem"]).astype({"eid": int})
members = lambda day: sp[(sp["add"] <= day) & (sp["rem"] >= day)]

# Month-end market values of every security that was ever a member since 1980
ids = sorted(set(sp.loc[sp["rem"] >= "1980-01-01", "eid"]) | {10006133})
mo = pd.concat([xfl.prices(entity_id=ids[i:i + 50], start="1980-01-01", end="2025-12-31", interval="1mo",
                           fields=["close", "market_cap"], max_rows=250_000)
                for i in range(0, len(ids), 50)], ignore_index=True)
mo["m"] = mo["date"].dt.to_period("M")
cap = mo.drop_duplicates(["entity_id", "m"]).pivot(index="m", columns="entity_id", values="market_cap")
cal = xfl.prices(entity_id=10001013, start="1979-12-01", end="2026-06-30", fields=["close"], max_rows=50_000)
days = pd.DatetimeIndex(sorted(cal["date"].unique()))
mends = pd.Series(days).groupby(days.to_period("M")).max()   # last trading day of each month

def rank(day, e):
    """Company value at a month-end and its percentile among the other members that day."""
    ids = set(members(day)["eid"])
    ids |= {10006133} if 10025221 in ids else set()
    co = (cap.loc[day.to_period("M")].reindex(sorted(ids))
          .groupby(lambda x: CLASS_OF.get(x, x)).sum(min_count=1).dropna())
    others = co.drop(e, errors="ignore")
    return co.get(e, np.nan), 100 * (others < co.get(e, np.nan)).mean(), others.median()

# Classify each removal by how long its own shares kept trading, then rank it at exit
rem = rems[rems["eff"].between("1990-01-01", "2025-12-31")]
rows = []
for y, g in rem.groupby(rem["eff"].dt.year):
    eids = sorted(set(g["entity_id"]))
    end = min(pd.Timestamp(f"{y + 1}-06-15"), pd.Timestamp("2026-06-15")).date().isoformat()
    p = pd.concat([xfl.prices(entity_id=eids[i:i + 50], start=f"{y - 1}-12-15", end=end,
                              fields=["close", "market_cap"], max_rows=250_000)
                   for i in range(0, len(eids), 50)])
    for r in g[~g["entity_id"].isin(CLASS_OF)].drop_duplicates(["entity_id", "eff"]).itertuples():
        after = int((p.loc[p["entity_id"] == r.entity_id, "date"].drop_duplicates() > r.eff).sum())
        T = mends[mends <= r.eff].iloc[-1]                     # last month-end as a member
        v, pct, med = rank(T, r.entity_id)
        added = sp.loc[(sp["eid"] == r.entity_id) & (sp["rem"] == r.eff), "add"].min()
        rows.append({"eff": r.eff, "after": after, "cap": v, "pct": pct, "med": med,
                     "days_in": (r.eff - added).days})
res = pd.DataFrame(rows)
dem = res[(res["after"] >= 63) & (res["days_in"] >= 30) & (res["eff"] != "2002-07-19")].dropna(subset=["cap"])
acq = res[(res["after"] <= 5) & (res["days_in"] >= 30)]
era = lambda d: pd.cut(d["eff"].dt.year, [1989, 1999, 2009, 2019, 2025])
print(dem.groupby(era(dem), observed=True).agg(n=("cap", "size"), exit_bn=("cap", "median"),
      member_bn=("med", "median"), pctile=("pct", "median")).assign(exit_bn=lambda t: t.exit_bn / 1e9,
      member_bn=lambda t: t.member_bn / 1e9).round(2))
print(acq.groupby(era(acq), observed=True)["pct"].median().round(1))
Full script with formatting and visualisation: sp500-removals-market-cap-at-removal-python.py
Output
S&P 500 removals effective 1990-2025: 852 (second share classes folded into the company)
  rebuilt rosters equal index(as_of) on 4 of 4 test dates
  stopped trading within 5 trading days: 446; still trading 63+ days later: 374; in between: 32
  still trading, set aside: member under 30 days 23, non-US removals of 2002-07-19 7, no market value at the last month-end 2
  demoted members valued: 342; other members valued at each of their month-ends: 498-500

Demoted members at their last month-end in the index (company market value)
era      n   median exit  median member  exit pctile  in bottom 2%  bottom 10%  a stayer was smaller
1990s    78   $  0.44bn   $     4.4bn          1.4           53%         72%                  73%
2000s   102   $  1.15bn   $     8.3bn          1.3           58%         75%                  75%
2010s    97   $  3.30bn   $    17.9bn          0.4           84%         90%                  57%
2020-25  65   $  5.29bn   $    32.0bn          0.2           95%         98%                  32%

For contrast, stopped trading at removal (mostly acquired): median exit pctile by era
  1990s 50.7 (n=130)  2000s 47.5 (n=164)  2010s 41.6 (n=112)  2020-25 26.1 (n=39)

Demoted members that joined in 1980 or later: 257
  median pctile at entry 34.9, at exit 0.4; entered in the bottom 10% 6%
  exit value / entry value: median 0.54; below entry value 74%
  size relative to the median member, exit / entry: median 0.24
  median years in the index 8.7

Demoted at a month-end on or after 2007-07-18 (guideline for new additions in force): 201
  2007-14  n= 82  below the guideline  73%  median exit / guideline 0.52
  2015-19  n= 54  below the guideline  93%  median exit / guideline 0.60
  2020-25  n= 65  below the guideline 100%  median exit / guideline 0.34
  all      n=201  below the guideline  87%  median exit / guideline 0.45

Today's roster, 498 companies valued on 2026-11-18: smallest $6.3bn, 10th smallest $9.5bn, median $43.5bn
  2020-25 demoted exits below today's smallest member: 47 of 65
  demoted members 1990-2025 that are in today's index: 19 of 342

Demoted from the upper half of the index: 17
  1990-03-02  LINB  LIN BROADCASTING CORP          $  5.8bn  pctile 80.1
  1990-03-06  GNN   GREAT NORTHERN NEKOOSA CORP    $  3.6bn  pctile 66.7
  1993-03-05  HUM   HUMANA INC                     $  3.1bn  pctile 50.5
  1993-11-22  PCI   PARAMOUNT COMMUNICATIONS INC   $  9.5bn  pctile 82.9
  1994-03-01  CNA   C N A FINANCIAL CORP           $  4.3bn  pctile 57.7
  1994-06-06  SYN   SYNTEX CORP                    $  5.1bn  pctile 65.1
  2000-07-12  KSU   KANSAS CITY SOUTHERN INDS INC  $  9.9bn  pctile 58.1
  2000-07-27  COMS  3COM CORP                      $ 21.1bn  pctile 78.2
  2006-07-31  CD    CENDANT CORP                   $ 15.0bn  pctile 61.5
  2008-07-17  ACE   ACE LTD                        $ 18.3bn  pctile 67.3
  2008-12-18  RIG   TRANSOCEAN INC NEW             $ 21.3bn  pctile 83.6
  2009-02-25  WFT   WEATHERFORD INTL LTD           $  7.6bn  pctile 57.9
  2009-03-16  TYC   TYCO INTERNATIONAL LTD BERMUDA $  9.5bn  pctile 66.5
  2009-03-26  NE    NOBLE CORP                     $  6.4bn  pctile 56.1
  2009-06-04  COV   COVIDIEN LTD                   $ 18.0bn  pctile 78.2
  2009-06-25  TEL   TYCO ELECTRONICS LTD           $  8.0bn  pctile 55.3
  2012-06-28  SLE   SARA LEE CORP                  $ 12.4bn  pctile 53.7
Smallest at exit, 2020-25:
  2020-04-03  M     MACYS INC                      $ 1.52bn  pctile  0.0
  2023-06-16  DISH  DISH NETWORK CORP              $ 1.89bn  pctile  0.0
  2020-05-21  HP    HELMERICH & PAYNE INC          $ 2.18bn  pctile  0.0
  2020-06-19  ADS   ALLIANCE DATA SYSTEMS CORP     $ 2.21bn  pctile  0.0
  2020-05-11  CPRI  CAPRI HOLDINGS LTD             $ 2.28bn  pctile  0.2
Demoted members leave from the bottom, acquired ones from the middle
The median demoted member ranked at the 1.4 percentile in the 1990s and at the 0.2 in 2020-25. In the 1990s and 2000s about three in four left while at least one member that stayed was smaller; in 2020-25 only 32% did, and the rest were smaller than every member that remained.
In dollars the median exit rose from $0.44 billion to $5.29 billion, about a tenth of the median member in the 1990s and a fifth to a sixth since 2010. Acquired members left from much higher in the index in every decade, at a median 51st percentile in the 1990s and the 26th in 2020-25.
The 257 demoted members that joined in 1980 or later entered at a median 34.9 percentile, and only 6% entered in the bottom tenth. After a median 8.7 years they left at 54% of their dollar value at entry and 24% of their size relative to the median member.
The guideline comparison measures the buffer members get: of 201 demotions since July 2007, 87% left below the floor for new additions, at a median 45% of it; in 2020-25 all did, at a median 34%. The 2007-14 share (73%) is lower because several large members left for reasons other than size, among them the re-domiciles described below.
“Still trading” does not prove a size-based demotion: 17 of the 342 left from the upper half, among them Transocean and ACE in 2008, removed as they moved their incorporation to Switzerland (S&P announcement, 11 December 2008), and break-ups such as Cendant’s in 2006.
Setting a deletion threshold for backtests and index research
Today’s roster gives the wrong reference point: its smallest member was worth $6.3 billion on 18 November 2026, yet 47 of the 65 members demoted in 2020-25 left below that value.
A model of likely deletions should rank candidates by market value within the point-in-time roster, not against the dollar guideline: the bottom 2% held 84% of demotions in the 2010s and 95% in 2020-25. Acquisitions, which leave from anywhere in the index, need a separate model.
Built with xfinlink — free financial data API for Python.