
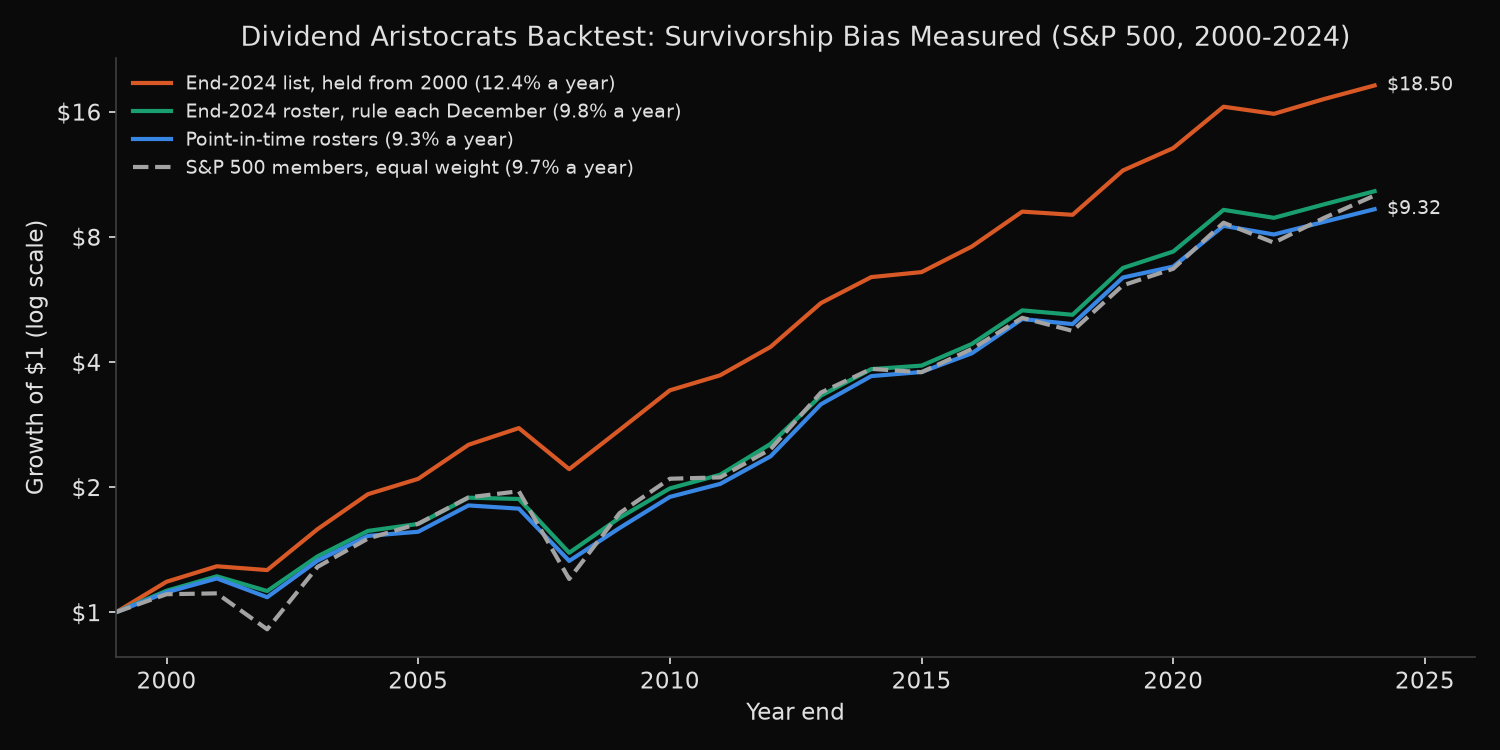
Holding the end-2024 Dividend Aristocrats-style list from 2000 returned 12.38% a year through 2024, while the same 25-year rule applied to the S&P 500 roster of each December returned 9.34%. The survivor version led by an average 2.88 points a year (paired t 3.83, ahead in 22 of 25 years) and turned a screen that trailed the equal-weight S&P 500 (9.67%) into one that finished ahead of it. Of those 2.88 points, 2.48 come from knowing which dividend streaks would last and 0.40 from members the index later removed.
Why a list of today’s aristocrats flatters its own past
A Dividend Aristocrat is an S&P 500 member that has raised its dividend for at least 25 consecutive years. Running the current list back in time adds two kinds of hindsight: companies removed, acquired or delisted are missing, and every name left is known to have kept raising its dividend throughout, which nobody knew in 2000. A bank that qualified until it cut in 2008 never enters such a backtest.
The test below separates the two with an aristocrat-style screen, the 25-year rule applied to the rosters of the time, not the official index roster; a separate post sorts S&P 500 members by trailing dividend yield on point-in-time rosters.
Rebuilding 25-year dividend streaks from 1962 records
- Rosters: the S&P 500 on the last business day of each December, 1999-2024, from
xfl.index("sp500", as_of=...)(index membership reference): 1,063 securities. - Dividends: monthly cash distributions since 1962, restated to today’s share basis with
split_ratio. Special dividends do not count; a payment that adds a special to a regular dividend counts as the previous regular payment. Four payments are classed as regular or special from the companies’ own announcements (Brown-Forman 2007, Cincinnati Financial 2015, Cintas 2014 and 2020). The 1,709 months holding a split and a dividend, or a special beside another payment, are re-read day by day. Return-of-capital distributions count as dividends. - A raise: a calendar year that pays more per share than the year before. When an ex-date crosses the year end, the average payment must rise instead: Caterpillar shows five payments in 2012 and three in 2013, and after ex-dates moved to the record date in May 2024, Air Products’ year-end ex-date fell on 2 January 2025, leaving three payments in 2024.
- A member whose streak reaches 25 in December is held the next calendar year, equal weight, bought and held; an exit takes its recorded delisting return, then cash. Returns end in December 2024.
- Portfolios: the point-in-time screen, the end-2024 list held from 2000, and the end-2024 roster screened each December, which separates hindsight about streaks from removed members; the benchmark is each December roster, equal weight.
Code
import numpy as np
import pandas as pd
import xfinlink as xfl

xfl.set_api_key("YOUR_API_KEY")  # free at https://xfinlink.com/signup
SPECIAL = "special_dividends"

# S&P 500 rosters on the last business day of each December, 1999-2024
forms = pd.date_range("1999-12-01", "2024-12-31", freq="BYE")
rosters = {d.year: xfl.index("sp500", as_of=d.strftime("%Y-%m-%d")) for d in forms}
member = {y: set(r["entity_id"].dropna().astype(int)) for y, r in rosters.items()}
ids = sorted(set().union(*member.values()))

# Monthly bars since 1962: total return, cash distributions, splits
px = pd.concat(xfl.prices(entity_id=ids[i:i + 50], start="1962-01-01", end="2024-12-31", interval="1mo",
                          fields=["close", "adj_close", "return_daily", "dividend", "split_ratio"],
                          max_rows=250_000) for i in range(0, len(ids), 50)).reset_index(drop=True)
px["m"], px["year"] = px["date"].dt.to_period("M"), px["date"].dt.year
px = px.drop_duplicates(["entity_id", "m"]).sort_values(["entity_id", "m"]).reset_index(drop=True)
px["split"] = px["split_ratio"].fillna(1.0)
px["later"] = px.groupby("entity_id")["split"].transform(lambda s: s[::-1].cumprod()[::-1].shift(-1).fillna(1.0))
kinds = px["dividend_type"].fillna("")

# Restate each payment to today's share basis; split months and mixed months are read day by day
amb = px[((px["split"] != 1) & px["dividend"].notna()) | (kinds.str.contains(SPECIAL) & kinds.str.contains(","))]
pay = [px.loc[px["dividend"].notna() & ~px.index.isin(amb.index)].assign(amount=lambda x: x["dividend"] / x["later"])]
for y, g in amb.groupby("year"):
    d = xfl.prices(entity_id=sorted(g["entity_id"].unique()), start=f"{y}-01-01", end=f"{y}-12-31",
                   fields=["dividend", "split_ratio"], max_rows=100_000)
    d["m"] = d["date"].dt.to_period("M")
    d = d.merge(g[["entity_id", "m", "later"]], on=["entity_id", "m"]).sort_values(["entity_id", "date"])
    within = d.groupby(["entity_id", "m"])["split_ratio"].transform(
        lambda s: s.fillna(1.0)[::-1].cumprod()[::-1].shift(-1).fillna(1.0))
    pay.append(d.assign(amount=d["dividend"] / within / d["later"]).dropna(subset=["dividend"]))
pay = pd.concat(pay)[["entity_id", "date", "dividend", "dividend_type", "amount"]].sort_values(["entity_id", "date"])
# Four payments classed from the companies' announcements (sources in the full script):
# regular cash per share in that month, the rest special
CLASSED = {(10013874, "2007-04"): 0.0, (10010889, "2015-12"): 0.46,      # BF-B, CINF
           (10011063, "2014-11"): 0.85, (10011063, "2020-11"): 3.51}     # CTAS
regular = pd.Series([CLASSED.get(k) for k in zip(pay["entity_id"], pay["date"].dt.strftime("%Y-%m"))],
                    index=pay.index, dtype=float)
pay["amount"] *= (regular / pay["dividend"]).fillna(1.0)
pay["dividend_type"] = pay["dividend_type"].where(regular.isna(), "cash_dividend")
pay = pay[(pay["dividend_type"] != SPECIAL) & (pay["amount"] > 0)]
both = pay["dividend_type"].str.contains(SPECIAL)       # special added to a regular payment
last_regular = pay["amount"].mask(both).groupby(pay["entity_id"]).ffill()
pay["amount"] = np.where(both, np.fmin(pay["amount"], last_regular), pay["amount"])

# Calendar-year dividend per share and the 25-year streak
years = range(1962, 2025)
dec = px[px["date"].dt.month == 12].assign(on=True).pivot(index="entity_id", columns="year", values="on")
dec = dec.reindex(columns=years).notna()
pay["year"] = pay["date"].dt.year
dps = pay.pivot_table(index="entity_id", columns="year", values="amount", aggfunc="sum")
n = pay.pivot_table(index="entity_id", columns="year", values="amount", aggfunc="count")
dps = dps.reindex(index=dec.index, columns=years).fillna(0).where(dec)
n = n.reindex(index=dec.index, columns=years).fillna(0).where(dec)
full = dec & dec.shift(axis=1, fill_value=False)
prev, mean = dps.shift(axis=1), dps / n
n1, usual = n.shift(axis=1), n.T.rolling(5, min_periods=3).median().T.shift(axis=1)
moved = (n != n1) & (((n - n1).abs() == 1) | (n + n1 == 2 * usual))   # an ex-date crossed the year end
up = (full & full.shift(axis=1, fill_value=False) & (prev > 0)
      & ((dps > prev * 1.001) | (moved & (mean > mean.shift(axis=1) * 1.001))))
streak = pd.DataFrame(0, index=up.index, columns=up.columns)
for y in years[1:]:
    streak[y] = (streak[y - 1] + 1) * up[y]
aristo = {y: {e for e in member[y] if e in streak.index and streak.at[e, y] >= 25} for y in member}
survivors = aristo[2024]

# Monthly total returns, with each exit's recorded delisting return (one exit year per call)
R = px.pivot(index="m", columns="entity_id", values="return_daily").reindex(
    index=pd.period_range("2000-01", "2024-12", freq="M"))
last = R.apply(pd.Series.last_valid_index).dropna()
ended = last[last < pd.Period("2024-12", "M")]
for y, g in ended.groupby(ended.map(lambda p: p.year)):
    d = xfl.prices(entity_id=g.index.tolist(), start=f"{y}-01-01", end="2024-12-31", interval="1mo",
                   fields=["return_daily"])
    for e, v in (d.attrs["meta"].get("delisting") or {}).items():
        e, dr = int(e), v.get("delisting_return")
        if e in last.index and dr is not None and not np.isnan(dr):
            m = last[e] if pd.Period(v["event_date"], "M") <= last[e] else last[e] + 1
            if m <= R.index[-1]:
                R.loc[m, e] = (1 + np.nan_to_num(R.loc[m, e])) * (1 + dr) - 1
traded = {y: set(px.loc[px["m"] == pd.Period(f"{y}-12", "M"), "entity_id"]) for y in range(1999, 2024)}
held = lambda names, y: ((1 + R.loc[f"{y + 1}-01":f"{y + 1}-12", sorted(set(names) & traded[y])]
                          .fillna(0)).prod() - 1).mean()
books = {"point-in-time": lambda y: aristo[y], "end-2024 list": lambda y: survivors,
         "end-2024 roster, rule each December": lambda y: {e for e in member[2024]
                                                          if e in streak.index and streak.at[e, y] >= 25},
         "S&P 500 equal weight": lambda y: member[y]}
res = pd.DataFrame({k: [held(f(y), y) for y in range(1999, 2024)] for k, f in books.items()}, index=range(2000, 2025))
gap = res["end-2024 list"] - res["point-in-time"]
print(((1 + res).prod() ** (1 / 25) - 1).round(4).to_dict())
print(f"gap {gap.mean():.2%} a year, paired t {gap.mean() / gap.std() * 25 ** 0.5:.2f}")
Full script with formatting and visualisation: dividend-aristocrats-survivorship-bias-python.py
Output
26 December rosters 1999-2024, 1,063 securities, 1,709 months read day by day, 430 exit records

End-2024 roster, 25-year rule: 61 pass; official list: 69; on both: 61 (recall 88.4%, precision 100.0%)
  official, not passing: ABBV ABT AMCR CTAS KVUE LIN NUE PNR
  passing, not official: none

Calendar-year returns 2000-2024, equal weight, bought and held each year
portfolio                              names  a year    mean vs S&P EW     t
Point-in-time rosters                     57   9.34%  10.13%     -1.17 -0.73
End-2024 list, held from 2000             61  12.38%  13.01%     +1.71  1.01
End-2024 roster, rule each December       49   9.78%  10.53%     -0.76 -0.48
S&P 500 members, equal weight            502   9.67%  11.30%
end-2024 list minus point-in-time (total bias)   +2.88 points a year, paired t  3.83, ahead 22/25
  of which hindsight on the streak               +2.48 points a year, paired t  3.82, ahead 20/25
  of which members since removed                 +0.40 points a year, paired t  1.59, ahead 17/25
  2000-2012 a year: Point-in-time rosters 6.86%, End-2024 list 11.97%, End-2024 roster 7.43%, S&P 500 members 7.19%
  2013-2024 a year: Point-in-time rosters 12.09%, End-2024 list 12.83%, End-2024 roster 12.37%, S&P 500 members 12.42%
Inside each point-in-time list: 64.8% of names are on the end-2024 list (mean return 10.91%); the rest 7.11%

135 companies passed on a point-in-time roster, 1999-2023. At end-2024:
  on the end-2024 list                  58
  stopped trading (merger)              36
  in the S&P 500, streak ended          31
  left the S&P 500, still trading       10
  streak ended after passing: 58 (43.0%); stopped trading with the streak intact: 19
December 1999 list: 64 names, 21 on the end-2024 list; 40 of the end-2024 list were not on it (21 not yet S&P 500 members)
Calendar-year dividend not raised (streak ends), tickers as on the previous December's roster:
  2000   3  IFF MIL ONE
  2001   5  AHP HBAN NSI SAFC TRW
  2002   4  ABS K PLL XEL
  2003   3  BMY HNZ TE
  2005   2  MMC RRD
  2006   5  AT CAG MRK NUE SLE
  2007   3  FHN MO PGR
  2008   6  BAC CMA FITB KEY RF SNV
  2009  12  AVY BBT GCI GE HSY JCI LNC MAS MI MTB PFE STT
  2010   3  LLY SVU TEG
  2011   1  CTL
  2013   2  ABT PBI
  2016   1  HCP
  2020   2  UTX VFC
  2021   2  CTAS T
  2024   2  MMM WBA
Most of the gap is hindsight about which streaks would last
Restricting the universe to end-2024 members, with the rule applied as each December stood, adds only 0.40 points a year (t 1.59); knowing which streaks would survive adds 2.48 (t 3.82). Inside each point-in-time list, names that would reach the end-2024 list returned 10.91% a year and the rest 7.11%.
Most of the gap falls in 2000-2012 (11.97% a year against 6.86%), when the cuts came: six banks in 2008, among them Bank of America and KeyCorp, and twelve companies in 2009, General Electric and Pfizer included. Of the 135 companies that ever passed, 58 were on the end-2024 list, 31 were still members with the streak ended, 36 had been acquired and 10 had left the index. Only 21 of the 64 names on the December 1999 list made the end-2024 list. On point-in-time rosters the screen trailed the equal-weight S&P 500 by an average 1.17 points a year, a gap too small to tell from chance (t -0.73).
On the end-2024 roster the rule passes 61 companies, all among the 69 S&P Dow Jones Indices held after its January 2025 rebalance. Five of the eight misses (AbbVie, Amcor, Kenvue, Linde, Pentair) have shares that first traded between 2012 and 2023, too recent for 25 years on their own record. Abbott paid less per share in 2013, after the AbbVie separation. Nucor paid supplemental dividends on the same dates as the regular one, which a per-payment rule cannot separate, and Cintas, which moved from an annual to a quarterly dividend in 2020, paid less in calendar 2021 than in a 2020 that held both.
Testing a dividend-growth rule without knowing the future
Build the list at each rebalance from the roster in force and the dividends paid by that date, and keep acquired and removed companies with their exit returns. Membership alone fixes little: unless the streak is measured as of each date, about 2.5 points a year of hindsight remain. Past rosters are on the historical S&P 500 constituents page, and a study of removed members’ final two years in the index follows how those companies traded before they left.
Built with xfinlink — free financial data API for Python.