
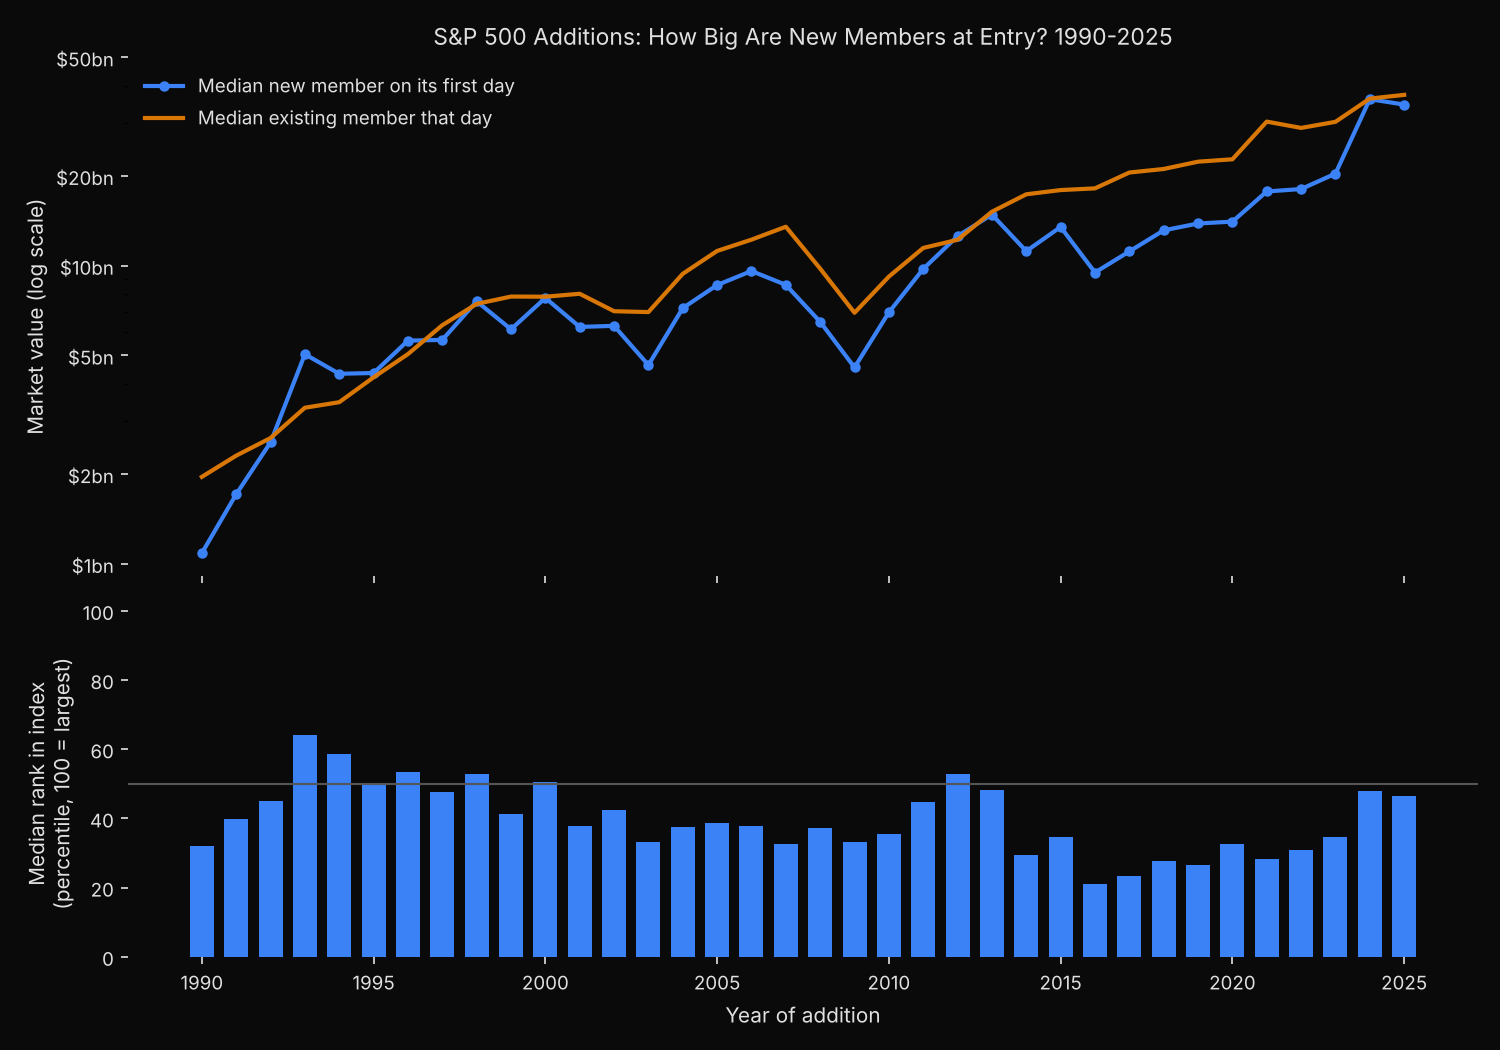
The median company added to the S&P 500 in 2024 and 2025 was worth $36.0 billion on its first day in the index, twelve times the $3.0 billion of a median addition in 1990–94. Against the index itself, new members joined near the middle in the 1990s, slid to about the 28th percentile in 2015–19 and were back at the 48th in 2024–25, level with the median existing member.
How big is a company when it joins the S&P 500?
A dollar figure drifts upward with the market, so the useful measure is relative. The entry percentile used here is the share of existing members smaller than the addition on its first day: 0 is the smallest company in the index, 100 the largest. The published floor has risen too: the guideline for new S&P 500 additions was an unadjusted company market cap of US$18.0 billion or more from 1 April 2024, US$20.5 billion from 2 January 2025 and US$22.7 billion from 1 July 2025 (S&P Dow Jones Indices press releases of those dates, checked on 10 October 2026).
Most companies added in the 1990s have since been acquired, merged or demoted, so a history rebuilt from today’s member list and its join dates sees only the minority that stayed, the trap set out in the survivorship bias explainer.
Valuing 813 additions on their first day in the index
- Pull every S&P 500 addition effective 1990 to 2025 from the index events log: 859 rows, each dated to the member’s first day as a member. Seven add a second share class of a company already in the index, such as Google’s (now Alphabet’s) Class C shares in 2014, and are not new members.
- Value each addition at its first close in the index times the shares outstanding of its listed common stock. A stock that began trading days before joining, as most spin-offs do, takes the first share count reported for it. Two classes that are both index lines are summed, as are Berkshire Hathaway’s Class A and B shares; classes that do not trade are not counted.
- Set aside the 39 additions whose split-adjusted share count moved by more than a fifth within 75 days of joining, most of them companies that joined as a stock-financed merger closed, the rest recent spin-offs and share offerings.
- Value every member of the roster from
index("sp500", as_of=day)the same way, and record the addition’s entry percentile and the median member’s value. - Rebuild the sample the survivors-only way, from today’s roster and its
added_datecolumn, and compare.
Code
import xfinlink as xfl
import pandas as pd
from concurrent.futures import ThreadPoolExecutor

xfl.set_api_key("YOUR_API_KEY")  # free at https://xfinlink.com/signup

# Second share classes -> the company's first index line; BRK-A trades but is not an index line
CLASS_OF = {10003590: 10030636, 10032892: 10031087, 10006698: 10006697, 10003102: 10003101,
            10030753: 10030752, 10004763: 10031256, 10029970: 10029932, 10006133: 10025221}

def events(kind, start, end=None):
    pages = [xfl.index_events("sp500", event_type=kind, start=start, end=end)]
    while len(pages[-1]) == 1000:  # one call returns at most 1,000 rows
        pages.append(xfl.index_events("sp500", event_type=kind, start=start, end=end,
                                      offset=1000 * len(pages)))
    return pd.concat(pages, ignore_index=True)

ev = events("added", "1990-01-01", "2025-12-31").astype({"entity_id": int})
exits = events("removed", "1990-01-01")

def first_day(r):
    """First day in the index: its close x the first share count reported; whether the stock
    began trading under 30 days earlier; split-adjusted share change over the next 75 days."""
    eff = pd.Timestamp(r.effective_date)
    p = xfl.prices(entity_id=r.entity_id, start=(eff - pd.Timedelta(days=45)).strftime("%Y-%m-%d"),
                   end=(eff + pd.Timedelta(days=90)).strftime("%Y-%m-%d"),
                   fields=["close", "adj_close", "market_cap"])
    p = p.dropna(subset=["close"]).assign(date=lambda x: pd.to_datetime(x["date"])).sort_values("date")
    new_listing = p["date"].iloc[0] > eff - pd.Timedelta(days=30)
    p = p[p["date"] >= eff]
    s = p.dropna(subset=["market_cap"])
    s = s[s["date"] <= s["date"].iloc[0] + pd.Timedelta(days=75)]
    shares = s["market_cap"] / s["adj_close"]  # in today's split terms
    return (p["date"].iloc[0].strftime("%Y-%m-%d"),
            p["close"].iloc[0] * s["market_cap"].iloc[0] / s["close"].iloc[0],
            new_listing, shares.iloc[-1] / shares.iloc[0])

def priced(ids, day):
    chunks = [ids[i:i + 25] for i in range(0, len(ids), 25)]
    with ThreadPoolExecutor(8) as ex:
        out = ex.map(lambda c: xfl.prices(entity_id=c, start=day, end=day, fields=["market_cap"]), chunks)
    return pd.concat(out).set_index("entity_id")["market_cap"]

with ThreadPoolExecutor(8) as ex:
    ev["day"], ev["line_cap"], ev["new_listing"], ev["share_change"] = zip(*ex.map(first_day, ev.itertuples()))

rows = []
for day, g in ev.groupby("day"):
    roster = xfl.index("sp500", as_of=day).dropna(subset=["entity_id"])
    ids = roster["entity_id"].astype(int).tolist()
    ids += [10006133] if 10025221 in ids else []
    caps = priced(ids, day).combine_first(g.set_index("entity_id")["line_cap"])
    co = caps.groupby(lambda e: CLASS_OF.get(e, e)).sum(min_count=1).dropna()
    for r in g[~g["entity_id"].isin(CLASS_OF)].itertuples():  # a second class is not a new member
        others = co.drop(r.entity_id)
        out = exits[(exits["entity_id"] == r.entity_id) & (exits["effective_date"] >= r.effective_date)]
        rows.append({"entity_id": r.entity_id, "name": r.entity_name, "date": r.effective_date,
                     "cap_bn": co[r.entity_id] / 1e9, "pctile": 100 * (others < co[r.entity_id]).mean(),
                     "median_member_bn": others.median() / 1e9, "members_valued": len(others),
                     "new_listing": r.new_listing, "share_change": r.share_change,
                     "last_day": out["effective_date"].min()})
adds = pd.DataFrame(rows)
adds["year"] = adds["date"].str[:4].astype(int)
adds["placement"] = (pd.to_datetime(adds["last_day"]) - pd.to_datetime(adds["date"])).dt.days < 30
moved = (adds["share_change"] > 1.2) | (adds["share_change"] < 1 / 1.2)  # mostly stock-financed mergers
sample = adds[~moved].copy()

today = xfl.index("sp500").dropna(subset=["entity_id"])
now_ids = set(today["entity_id"].astype(int).map(lambda e: CLASS_OF.get(e, e)))
sample["member_today"] = sample["entity_id"].isin(now_ids)
spells = set(zip(today["entity_id"].astype(int), today["added_date"]))
sample["in_todays_list"] = [(e, d) in spells for e, d in zip(sample["entity_id"], sample["date"])]

sample["period"] = pd.cut(sample["year"], [1989, 1994, 1999, 2004, 2009, 2014, 2019, 2023, 2025])
print(sample.groupby("period", observed=True)[["cap_bn", "median_member_bn", "pctile"]].median().round(1))
print(sample.groupby(sample["year"] // 10 * 10)["in_todays_list"].agg(["size", "sum"]))
Full script with formatting and visualisation: sp500-additions-market-cap-at-entry-python.py
Output
S&P 500 additions effective 1990-2025: 859 in the log
  second share classes of members set aside: 7
  share count moved >20% within 75 days of joining, set aside: 39
  additions valued: 813; members valued on each entry day: 496-502
  began trading under 30 days before joining: 124; left the index within 30 days: 24

period   adds  median entry  median member  entry pctile  (not newly listed)  newly listed  in index today
1990-94     61  $      3.0bn  $       2.8bn         48.5                50.0          15%            15%
1995-99    154  $      6.0bn  $       6.5bn         49.1                49.4          14%            32%
2000-04    132  $      6.6bn  $       8.0bn         42.8                43.3           9%            26%
2005-09    144  $      7.4bn  $      11.5bn         37.0                36.9          12%            40%
2010-14     79  $     11.0bn  $      12.1bn         42.9                44.1          18%            52%
2015-19    136  $     12.1bn  $      19.9bn         27.7                29.1          23%            58%
2020-23     71  $     17.7bn  $      29.1bn         30.9                31.5          20%            69%
2024-25     36  $     36.0bn  $      37.3bn         47.6                49.2          17%            92%

Survivors-only rebuild (today's members by their added date) vs the full log
  1990s: log 215 adds, median $5.6bn, pctile 49.0 | survivors  56, median $6.3bn, pctile 54.6
  2000s: log 276 adds, median $7.1bn, pctile 39.1 | survivors  84, median $7.8bn, pctile 41.0
  2010s: log 215 adds, median $11.9bn, pctile 32.3 | survivors 119, median $13.2bn, pctile 35.7
  2020s (2020-25): log 107 adds, median $20.5bn, pctile 36.7 | survivors  82, median $24.1bn, pctile 40.6

Additions 1990-2009 (491) by entry percentile: share still in the index today
  bottom quarter    52 adds  median $  3.7bn  still members 25%
  second quarter   265 adds  median $  5.7bn  still members 28%
  third quarter    130 adds  median $  8.8bn  still members 32%
  top quarter       44 adds  median $ 24.4bn  still members 43%

Smallest at entry:
  2016-10-03  Advansix Inc                       $  0.50bn  pctile   0.0
  1990-06-08  Morrison Knudsen Corp              $  0.61bn  pctile  12.2
  1992-07-06  Giddings & Lewis Inc Wis           $  0.68bn  pctile  12.0
  1996-07-22  Battle Mountain Gold Co            $  0.69bn  pctile   3.8
  1990-02-08  Harrahs Entertainment Inc          $  0.72bn  pctile  16.0
Largest at entry:
  2020-12-21  Tesla Inc                          $ 616.0bn  pctile  99.0
  2025-09-22  AppLovin                           $ 198.0bn  pctile  90.6
  2017-09-01  Dupont De Nemours Inc              $ 156.9bn  pctile  94.0
  2021-07-21  Moderna Inc                        $ 129.4bn  pctile  86.6
  2023-12-18  Uber Technologies Inc              $ 127.0bn  pctile  87.2
Why new members slid to the bottom third and returned
In dollars the climb is steady apart from dips after the 2000–02 and 2008–09 bear markets and another in 2014–16. Through the 1990s the median addition sat at the 49th percentile; by 2015–19 it was at the 28th, because entry sizes rose about 11% on 2010–14 while the median member’s value rose 64%. The additions of 2024–25 closed the gap, at a median $36.0 billion against $37.3 billion.
Spin-offs cluster in the dip but do not explain it. Between 2015 and 2023, 24 additions left within 30 days, mostly spin-offs that stayed for one to four sessions; AdvanSix, the smallest addition in the sample at $0.50 billion, was in and out on 3 October 2016. Dropping every addition that began trading less than 30 days before joining lifts the 2015–19 median percentile only from 27.7 to 29.1.
The survivors-only rebuild finds 56 of the 215 additions made in the 1990s and overstates the median entry size in every decade, by 9.7% to 17.6%, with entry percentiles two to six points too high. The last block shows why: of the 1990–2009 additions, 43% of those that entered in the index’s top quarter are members today, against 25% of those that entered in its bottom quarter. Small entrants leave more often.
Setting a size cut-off for future additions
A model of which companies join next needs the size bar of its own period. Calibrated on 2015–19, it would look for candidates in the bottom third of the index; on 2024–25, near the middle. Calibrated on today’s list, it learns from survivors and sets the bar roughly 10% to 18% too high. The guide to S&P 500 additions and deletions history covers the dated log such a model is built on.
Event studies should hold short placements and merger-driven entries apart from ordinary additions; an event study of S&P 500 additions measures returns around the effective date. Rosters for any day come from as_of on the index membership endpoint, and the S&P 500 members on any past date can be looked up without code.
Built with xfinlink — free financial data API for Python.