
Forty-eight companies have ranked among the ten largest in the S&P 500 in at least one January since 1980, leaving aside the two Dutch members removed in 2002, and 13 of them are no longer in the index. Half of the January 1980 top 10 is gone, AT&T Corp., General Motors, Amoco, Mobil and Atlantic Richfield among them, so a top-10 history rebuilt from today’s member list loses five of that year’s names.
Why a top-10 history needs the companies that left
Tables of the largest S&P 500 companies by year show leadership moving from oil and industrials to technology, and raise two questions: how long a place in the top 10 lasts, and what becomes of the companies that lose it. Both answers depend on rosters that keep the departed. A list drawn from today’s constituents ranks the 1980 index without its second-largest member, which is survivorship bias in its plainest form.
Tickers add a second trap: the AT&T and General Motors of 1980 are not the companies carrying those names today, and a join by symbol silently attaches one company’s rank to another’s record.
How the rankings were rebuilt for 47 Januaries
- Pull the S&P 500 roster on the first trading day of each January, 1980 to 2026, with
as_of; it includes members that later left. - Value each company that day at the closing price times shares outstanding of its listed common stock. Two classes that are both index lines (Alphabet’s GOOGL and GOOG) are summed through an explicit map, and Berkshire Hathaway’s Class A shares, which trade but are not an index line, are added to its Class B. Classes that do not trade, such as the Class B shares of Alphabet, Meta and Visa, have no market price and are not counted, so tables that value every class rank those three higher in some years. Tracking stocks, such as General Motors’ Class E and H shares and AT&T’s Liberty Media Group shares, follow a subsidiary’s business and are not counted either.
- Rank and keep the ten largest. The two Dutch members S&P removed after the close on 19 July 2002, Royal Dutch Petroleum and Unilever N.V., are left out, so published tables that include Royal Dutch differ for earlier years. Members with no closing price on the day are not ranked: at most nine, in January 1984, seven of them the regional Bell companies created by the AT&T break-up that took effect on 1 January.
- Key each company on
entity_idand check whether it is a member today. - Count how many of each January’s top 10 are still in the top 10, and in the index, 10 and 20 years later.
Code
import xfinlink as xfl
import pandas as pd

xfl.set_api_key("YOUR_API_KEY")  # free at https://xfinlink.com/signup

EXTRA_CLASSES = {10006133: 10025221}   # BRK-A trades but is not an index line
SAME_COMPANY = {10003590: 10030636, 10032892: 10031087, 10006698: 10006697,
                10003102: 10003101, 10030753: 10030752, 10031256: 10004763}
CLASS_OF = {**EXTRA_CLASSES, **SAME_COMPANY}  # second class -> company id
LEFT_OUT = {10012474, 10013712}        # Royal Dutch Petroleum, Unilever N.V.

ibm = xfl.prices(entity_id=10001962, start="1980-01-01", end="2026-01-31", fields=["close"])
ibm["date"] = pd.to_datetime(ibm["date"])
jan = ibm[ibm["date"].dt.month == 1]
first_days = jan.groupby(jan["date"].dt.year)["date"].min().dt.strftime("%Y-%m-%d")

rows = []
for year in range(1980, 2027):
    day = first_days[year]
    roster = xfl.index("sp500", as_of=day).dropna(subset=["entity_id"])
    roster = roster.astype({"entity_id": int})
    roster = roster[~roster["entity_id"].isin(LEFT_OUT)]
    ids = roster["entity_id"].tolist()
    ids += [a for a, b in EXTRA_CLASSES.items() if b in ids]
    px = xfl.prices(entity_id=ids, start=day, end=day, fields=["close", "market_cap"])
    px["company"] = px["entity_id"].replace(CLASS_OF)
    mv = px.groupby("company")["market_cap"].sum(min_count=1)
    snap = roster.assign(company=roster["entity_id"].replace(CLASS_OF)).sort_values("added_date")
    co = (snap.groupby("company", as_index=False)
              .agg(ticker=("ticker", "first"), entity_name=("entity_name", "first"))
              .rename(columns={"company": "entity_id"}))
    co["market_cap"] = co["entity_id"].map(mv)
    co = co.dropna(subset=["market_cap"]).nlargest(10, "market_cap")
    rows.append(co.assign(year=year))
top = pd.concat(rows)

members_now = set(xfl.index("sp500")["entity_id"].dropna().astype(int))
sets = top.groupby("year")["entity_id"].apply(set)
for k in (10, 20):
    kept = [len(sets[y] & sets[y + k]) for y in sets.index if y + k in sets.index]
    print(k, "years on, still top 10:", sum(kept) / len(kept))
print("companies:", top["entity_id"].nunique(),
      "gone from the index:", len(set(top["entity_id"]) - members_now))
Full script with formatting and visualisation: largest-sp500-companies-top-10-history-python.py
Output
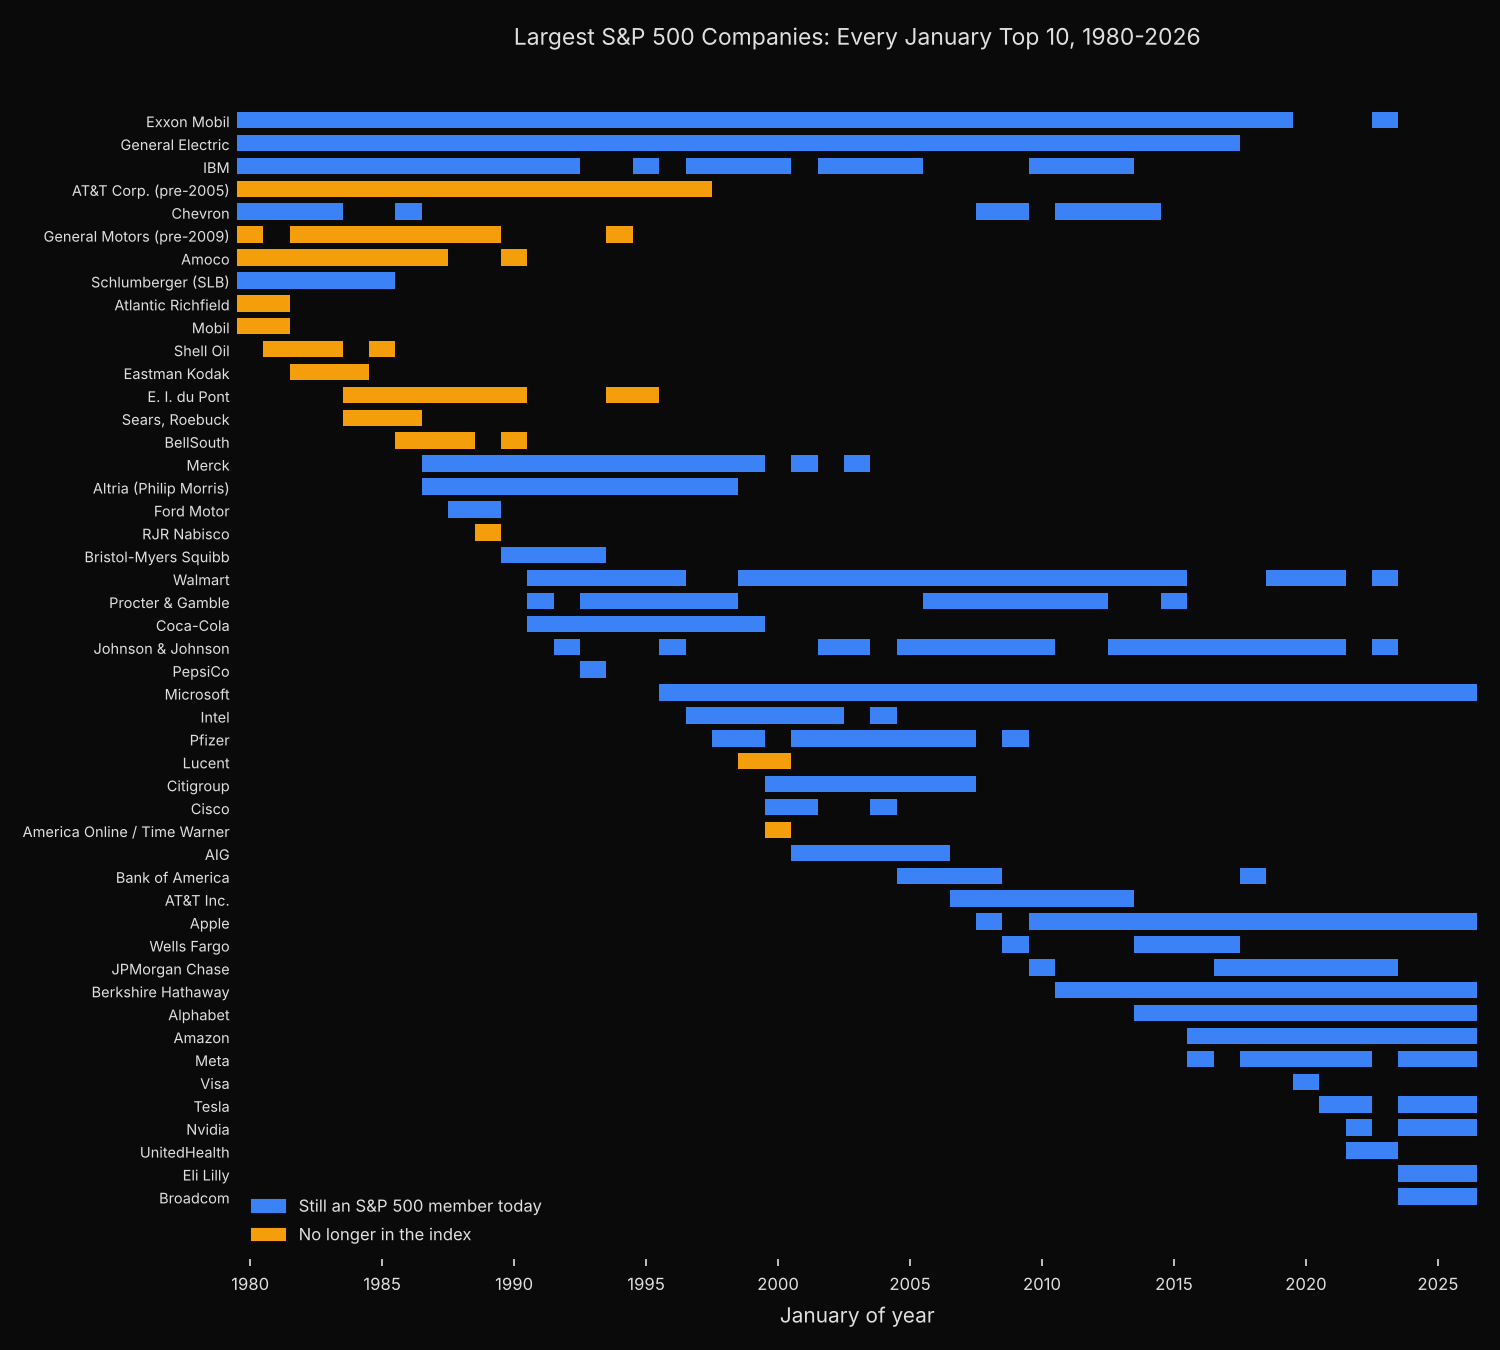
47 Januaries 1980-2026; members ranked per roster 498-505, with a market value on the day 489-505

Top 10 on 1980-01-02  (top 10's share of ranked value 25.3%; S&P 500 members today: 5 of 10)
   1. IBM    IBM                          $    36.5bn
   2. T      AT&T Corp. (pre-2005)        $    36.5bn
   3. XON    Exxon Mobil                  $    23.6bn
   4. GM     General Motors (pre-2009)    $    14.4bn
   5. SN     Amoco                        $    11.6bn
   6. SLB    Schlumberger (SLB)           $    11.3bn
   7. GE     General Electric             $    11.1bn
   8. MOB    Mobil                        $    10.9bn
   9. SD     Chevron                      $     9.3bn
  10. ARC    Atlantic Richfield           $     9.1bn

Top 10 on 1990-01-02  (top 10's share of ranked value 17.7%; S&P 500 members today: 6 of 10)
   1. XON    Exxon Mobil                  $    62.6bn
   2. GE     General Electric             $    60.2bn
   3. IBM    IBM                          $    56.7bn
   4. T      AT&T Corp. (pre-2005)        $    50.0bn
   5. MO     Altria (Philip Morris)       $    39.7bn
   6. MRK    Merck                        $    31.1bn
   7. BMY    Bristol-Myers Squibb         $    29.7bn
   8. DD     E. I. du Pont                $    29.3bn
   9. BLS    BellSouth                    $    28.4bn
  10. AN     Amoco                        $    27.9bn

Top 10 on 2000-01-03  (top 10's share of ranked value 26.1%; S&P 500 members today: 8 of 10)
   1. MSFT   Microsoft                    $   601.5bn
   2. GE     General Electric             $   491.6bn
   3. CSCO   Cisco                        $   353.5bn
   4. WMT    Walmart                      $   297.8bn
   5. INTC   Intel                        $   290.7bn
   6. XOM    Exxon Mobil                  $   270.7bn
   7. LU     Lucent                       $   242.2bn
   8. IBM    IBM                          $   208.4bn
   9. AOL    America Online / Time Warner $   185.3bn
  10. C      Citigroup                    $   178.3bn

Top 10 on 2010-01-04  (top 10's share of ranked value 19.6%; S&P 500 members today: 10 of 10)
   1. XOM    Exxon Mobil                  $   327.2bn
   2. MSFT   Microsoft                    $   272.7bn
   3. WMT    Walmart                      $   206.6bn
   4. AAPL   Apple                        $   194.0bn
   5. PG     Procter & Gamble             $   178.6bn
   6. JNJ    Johnson & Johnson            $   178.5bn
   7. JPM    JPMorgan Chase               $   175.9bn
   8. IBM    IBM                          $   174.0bn
   9. T      AT&T Inc.                    $   168.7bn
  10. GE     General Electric             $   164.5bn

Top 10 on 2020-01-02  (top 10's share of ranked value 24.4%; S&P 500 members today: 10 of 10)
   1. AAPL   Apple                        $ 1,316.7bn
   2. MSFT   Microsoft                    $ 1,222.5bn
   3. AMZN   Amazon                       $   945.2bn
   4. GOOGL  Alphabet                     $   878.1bn
   5. BRK-B  Berkshire Hathaway           $   558.3bn
   6. FB     Meta                         $   504.9bn
   7. JPM    JPMorgan Chase               $   442.5bn
   8. JNJ    Johnson & Johnson            $   384.2bn
   9. WMT    Walmart                      $   337.5bn
  10. V      Visa                         $   327.2bn

Top 10 on 2026-01-02  (top 10's share of ranked value 40.3%; S&P 500 members today: 10 of 10)
   1. NVDA   Nvidia                       $ 4,589.1bn
   2. AAPL   Apple                        $ 4,004.5bn
   3. GOOGL  Alphabet                     $ 3,538.5bn
   4. MSFT   Microsoft                    $ 3,515.1bn
   5. AMZN   Amazon                       $ 2,421.3bn
   6. AVGO   Broadcom                     $ 1,648.2bn
   7. TSLA   Tesla                        $ 1,456.9bn
   8. META   Meta                         $ 1,416.5bn
   9. BRK-B  Berkshire Hathaway           $ 1,071.3bn
  10. LLY    Eli Lilly                    $ 1,021.4bn

Companies in a January top 10, 1980-2026: 48
  still S&P 500 members today:  35
  no longer in the index:       13
  median Januaries in top 10:   7

Top-10 companies no longer in the index:
  AT&T Corp. (pre-2005)        top 10 1980-1997, 18 of 47 Januaries; last day in index 2005-11-18
  Atlantic Richfield           top 10 1980-1981,  2 of 47 Januaries; last day in index 2000-04-17
  General Motors (pre-2009)    top 10 1980-1994, 10 of 47 Januaries; last day in index 2009-06-02
  Amoco                        top 10 1980-1990,  9 of 47 Januaries; last day in index 1998-12-31
  Mobil                        top 10 1980-1981,  2 of 47 Januaries; last day in index 1999-11-30
  Shell Oil                    top 10 1981-1985,  4 of 47 Januaries; last day in index 1985-06-12
  Eastman Kodak                top 10 1982-1984,  3 of 47 Januaries; last day in index 2010-12-17
  E. I. du Pont                top 10 1984-1995,  9 of 47 Januaries; last day in index 2017-08-31
  Sears, Roebuck               top 10 1984-1986,  3 of 47 Januaries; last day in index 2005-03-24
  BellSouth                    top 10 1986-1990,  4 of 47 Januaries; last day in index 2007-01-03
  RJR Nabisco                  top 10 1989-1989,  1 of 47 Januaries; last day in index 1989-02-08
  Lucent                       top 10 1999-2000,  2 of 47 Januaries; last day in index 2006-11-30
  America Online / Time Warner top 10 2000-2000,  1 of 47 Januaries; last day in index 2018-06-19

Most Januaries in the top 10:
  Exxon Mobil                  41 of 47
  General Electric             38 of 47
  Microsoft                    31 of 47
  Walmart                      27 of 47
  IBM                          26 of 47
  Johnson & Johnson            20 of 47

Each January's top 10, 10 years later (37 starting years, 1980-2016):
  still in the top 10:  mean 4.4 of 10 (range 3-6)
  still in the S&P 500: mean 9.7 of 10 (range 9-10)

Each January's top 10, 20 years later (27 starting years, 1980-2006):
  still in the top 10:  mean 2.6 of 10 (range 1-5)
  still in the S&P 500: mean 8.7 of 10 (range 6-10)
Who held the top spots, and how the leavers left
Exxon Mobil appears in 41 of the 47 lists and General Electric in 38; the median company that reached the top 10 stayed for seven Januaries. Ten years after any January, 9.7 of that year’s ten largest were still S&P 500 members on average, yet only 4.4 were still among the ten largest, and never more than six. After 20 years the average falls to 2.6.
The 13 departures in this ranking were mostly not failures. Eleven left through a merger or buyout: Amoco and Atlantic Richfield into BP, Mobil into Exxon, Shell Oil to its Royal Dutch/Shell parent, RJR Nabisco to a leveraged buyout, AT&T Corp. to SBC, BellSouth and Time Warner to the later AT&T, Sears to Kmart, Lucent to Alcatel and E. I. du Pont into DowDuPont. General Motors left in June 2009, the month it filed for bankruptcy, and Eastman Kodak in December 2010. Every company in the 2010 and 2020 lists is still a member.
AT&T Inc., in the top 10 from 2007 to 2013, is the former SBC; keyed on entity_id, it and the AT&T Corp. of 1980 count as two companies, which is what they are.
Using a historical top 10 without the survivor shortcut
A large-cap universe for a past date has to come from that date’s roster: a mega-cap strategy started in January 1990 from today’s list would hold six of the ten companies an investor could actually have bought. The four it drops, AT&T Corp., E. I. du Pont, BellSouth and Amoco, all left through mergers, an exit a survivor list cannot see at all. Their exit dates sit in the dated history of S&P 500 additions and deletions.
For a portfolio of the largest names that rebalances rarely, expect on average more than half of the ten to leave the top within a decade while nearly all stay in the index. The rosters here come from the as_of parameter on the index membership endpoint, and the S&P 500 roster on any past date can also be looked up without code. The other end of the size range, the value at which companies first join the index, is the subject of an analysis of S&P 500 additions by size at entry.
Built with xfinlink — free financial data API for Python.