
On the S&P 500 roster each month actually had, the fifth of members with the lowest past volatility returned 9.60% a year from 2000 to 2024 and the most volatile fifth returned 6.21%, a 3.39-point lead for low volatility. Run the same test on today’s roster and the result turns over: the most volatile fifth returns 23.73% a year against 11.88% for the calmest, a deficit of 11.85 points. On the survivor roster the anomaly runs backwards.
Why would a survivor roster flatter volatile stocks?
The low-volatility anomaly is the observation that stocks with steadier past returns have earned as much as, or more than, stocks with wild swings, although textbook finance says extra risk should be paid for. Minimum-volatility funds are built on it.
Survivorship bias, explained in the guide to survivorship bias in backtesting, enters when a test universe holds only companies still around. Volatile stocks are the ones most likely to have soared or collapsed, and today’s S&P 500 list keeps the soarers (that is how many got in) while dropping the collapses (that is how many left). Calm stocks have fewer extreme outcomes to filter, so the bias should land on the high-volatility end. The momentum backtest on point-in-time and survivor rosters asks the same question of a different signal.
Sorting each month’s members by 36 months of volatility
- Draw the S&P 500 roster on the last business day of each month from December 1999 to November 2024 with
xfl.index("sp500", as_of=...); each roster sets the next month’s universe. The index membership reference documentsas_of. - Pull monthly total returns from December 1996 for the 1,100 securities, keyed by entity id so a recycled ticker cannot swap companies.
- Measure each stock’s volatility as the annualised standard deviation of its monthly returns over the 36 months to the prior month end (at least 24 required), so the sort uses only past information.
- Split each month’s universe into volatility quintiles and hold each quintile equally weighted for one month. A holding that stops trading earns its return through its last trading day.
- Repeat with today’s roster as every month’s universe; members without 24 months of history sit out until they qualify.
Code
import numpy as np
import pandas as pd
import xfinlink as xfl

xfl.set_api_key("YOUR_API_KEY")  # free at https://xfinlink.com/signup

# The S&P 500 roster on the last business day of each month, Dec 1999 to Nov 2024,
# sets the holdings for the following month
dates = pd.date_range("1999-12-01", "2024-11-30", freq="BME")
pit = {d.to_period("M") + 1: set(xfl.index("sp500", as_of=d.strftime("%Y-%m-%d"))
                                 .entity_id.dropna().astype(int)) for d in dates}
today = set(xfl.index("sp500").entity_id.dropna().astype(int))

# Monthly total returns from December 1996, so every month has 36 months of history behind it
ids = sorted(set().union(*pit.values()) | today)
px = pd.concat(xfl.prices(entity_id=ids[i:i + 25], start="1996-12-01", end="2024-12-31",
                          interval="1mo", fields=["return_daily"], max_rows=100_000)
               for i in range(0, len(ids), 25))
px["month"] = px["date"].dt.to_period("M")
ret = px.pivot(index="month", columns="entity_id", values="return_daily")
# Volatility over the 36 months to the prior month end (at least 24 returns), annualised
vol = (ret.rolling(36, min_periods=24).std() * 12 ** 0.5).shift(1)
ret, vol = ret.loc["2000-01":], vol.loc["2000-01":]
print(f"{len(pit)} monthly rosters, {len(ids)} securities, {len(ret)} holding months")

def membership(members):
    return pd.DataFrame([ret.columns.isin(list(members(m))) for m in ret.index],
                        index=ret.index, columns=ret.columns)

pit_mask, today_mask = membership(lambda m: pit[m]), membership(lambda m: today)
annual = lambda r: (1 + r).prod() ** (12 / len(r)) - 1
results = {}
for name, mask in {"Point-in-time rosters": pit_mask, "Today's roster": today_mask}.items():
    v = vol.where(mask)
    quintile = np.ceil(v.rank(axis=1, pct=True) * 5)  # 1 = lowest volatility
    print(f"{name}: {v.notna().sum(axis=1).mean():.0f} stocks sorted a month on average")
    q = {}
    for k in range(1, 6):
        held = quintile == k
        q[k] = ret.where(held).mean(axis=1)
        risk = q[k].std() * 12 ** 0.5
        removed = (held & ~today_mask).sum(axis=1).div(held.sum(axis=1)).mean()
        print(f"  Q{k}: past volatility {v.where(held).stack().mean():.1%}, "
              f"return {annual(q[k]):.2%} a year, volatility {risk:.2%}, "
              f"return per unit of volatility {annual(q[k]) / risk:.2f}, "
              f"not in today's index {removed:.1%}")
    yearly = (1 + q[1]).groupby(q[1].index.year).prod() - (1 + q[5]).groupby(q[5].index.year).prod()
    print(f"  Low minus high volatility: {annual(q[1]) - annual(q[5]):+.2%} a year "
          f"(2000-2012 {annual(q[1][:'2012']) - annual(q[5][:'2012']):+.2%}, "
          f"2013-2024 {annual(q[1]['2013':]) - annual(q[5]['2013':]):+.2%}); "
          f"low volatility ahead in {(yearly > 0).sum()} of {len(yearly)} years")
    results[name] = q
Full script with formatting and visualisation: low-volatility-anomaly-survivorship-bias-python.py
Output
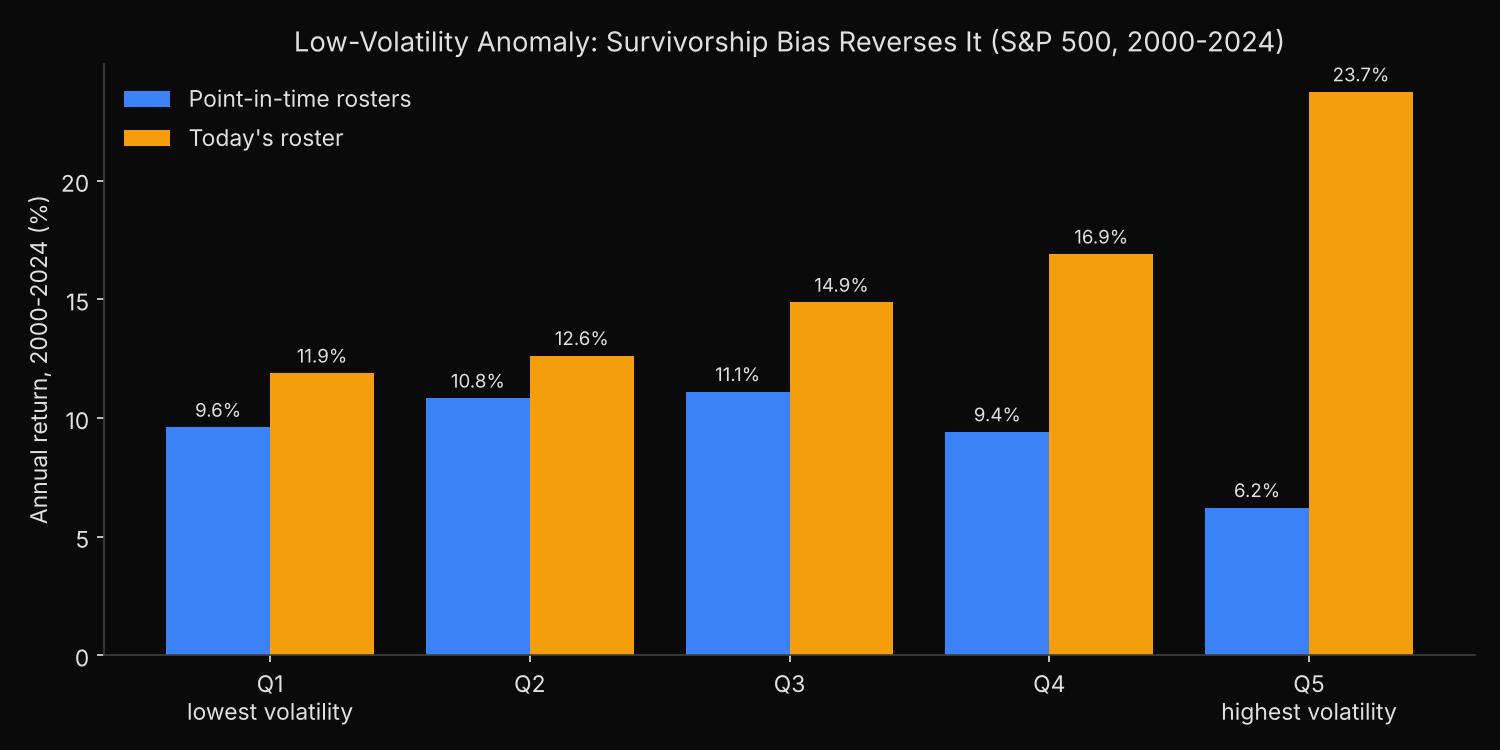
300 monthly rosters, 1100 securities, 300 holding months
Point-in-time rosters: 495 stocks sorted a month on average
  Q1: past volatility 18.5%, return 9.60% a year, volatility 12.24%, return per unit of volatility 0.78, not in today's index 23.7%
  Q2: past volatility 23.8%, return 10.83% a year, volatility 14.63%, return per unit of volatility 0.74, not in today's index 30.9%
  Q3: past volatility 28.4%, return 11.10% a year, volatility 17.73%, return per unit of volatility 0.63, not in today's index 37.0%
  Q4: past volatility 34.7%, return 9.40% a year, volatility 20.20%, return per unit of volatility 0.47, not in today's index 45.6%
  Q5: past volatility 51.4%, return 6.21% a year, volatility 29.48%, return per unit of volatility 0.21, not in today's index 54.6%
  Low minus high volatility: +3.39% a year (2000-2012 +5.72%, 2013-2024 +0.67%); low volatility ahead in 15 of 25 years
Today's roster: 412 stocks sorted a month on average
  Q1: past volatility 17.7%, return 11.88% a year, volatility 11.61%, return per unit of volatility 1.02, not in today's index 0.0%
  Q2: past volatility 23.0%, return 12.62% a year, volatility 14.16%, return per unit of volatility 0.89, not in today's index 0.0%
  Q3: past volatility 27.5%, return 14.87% a year, volatility 16.72%, return per unit of volatility 0.89, not in today's index 0.0%
  Q4: past volatility 33.8%, return 16.90% a year, volatility 19.27%, return per unit of volatility 0.88, not in today's index 0.0%
  Q5: past volatility 52.4%, return 23.73% a year, volatility 27.78%, return per unit of volatility 0.85, not in today's index 0.0%
  Low minus high volatility: -11.85% a year (2000-2012 -10.03%, 2013-2024 -13.89%); low volatility ahead in 7 of 25 years
Where the volatile quintile’s returns come from
On point-in-time rosters the anomaly appears in its classic form. Returns sit between 9.40% and 11.10% a year across the first four quintiles, then drop to 6.21% for the most volatile fifth, while realised risk more than doubles. Return per unit of volatility falls at every step, from 0.78 to 0.21. Most of the lead was earned in 2000–2012, at 5.72 points a year, against 0.67 points since 2013; low volatility finished ahead in 15 of the 25 calendar years.
The membership column explains the reversal. Of the stocks in the point-in-time high-volatility quintile, 54.6% in an average month are no longer in the index today, against 23.7% of the low-volatility quintile. In January 2000, 67 of the 98 stocks in that quintile are absent from today’s index, Sun Microsystems, Compaq, Nortel Networks and Yahoo among them, and Lehman Brothers was in it during its last month as a member, September 2008. Today’s roster removes such names and keeps companies like Nvidia, Netflix and Tesla, whose volatility came with large gains. Tesla joined the index in December 2020, yet the survivor book holds it from June 2012, in the top quintile in all 151 months. A study of how long S&P 500 members stay in the index follows that kind of turnover over decades.
The low-volatility end moves much less: up 2.28 points on the survivor roster, against 17.52 points for the high-volatility end. Return per unit of volatility on today’s roster changes little, from 1.02 to 0.85, so a survivor test would show volatile stocks paid roughly in proportion to their risk; on point-in-time rosters the ratio falls from 0.78 to 0.21.
Testing a low-volatility strategy without a survivor roster
A test that starts from a current constituent list builds in a bias against a low-volatility strategy, not for it, because the list has already cleaned out the companies the strategy would have avoided and added volatile winners years before they joined. A result showing volatile stocks winning is a symptom of the universe until it holds on dated rosters, such as the S&P 500 members on any past date.
Any volatility sort should also use only returns that ended before the rebalance and keep stocks that later stop trading through their last return. Since the anomaly has been small since 2013, a low-volatility allocation is better justified by its lower risk, 12.24% against 17.73% for the middle quintile here, than by a promise of higher returns.
Built with xfinlink — free financial data API for Python.