
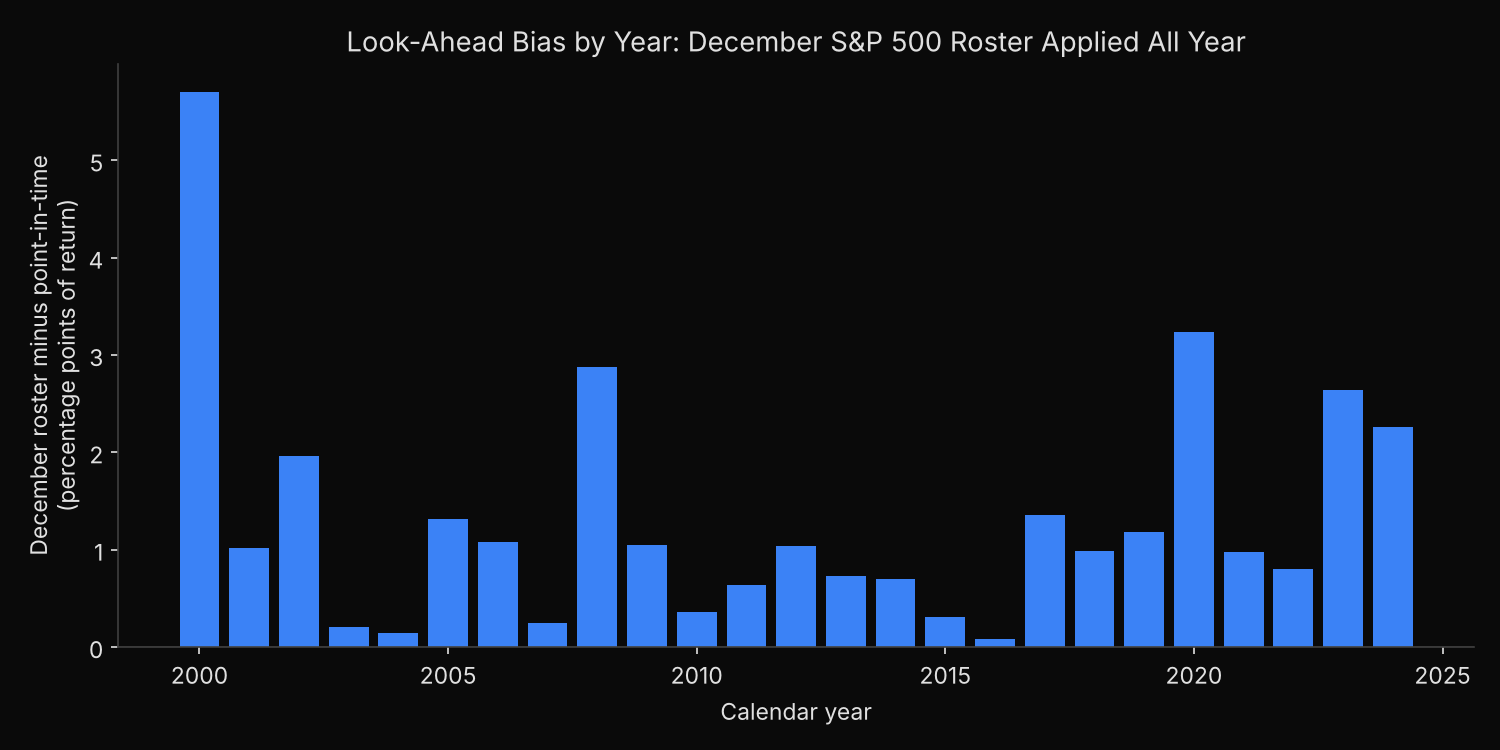
Applying each December’s S&P 500 roster to every month of the same year lifted an equal-weight, monthly-rebalanced backtest by 1.40 percentage points a year from 2000 to 2024, and the December roster came out ahead in all 25 years. The portfolio built from each month’s actual roster returned 9.79% a year and turned $1 into $10.33; the December-roster version returned 11.19% and reached $14.16. The January roster, stale by year-end but free of foresight, moved the result by only 0.21 points.
Why does a year-end constituent list leak the future?
A constituent list keyed by year is an easy file to build or download, and the natural roster to file under 2015 is the one in force on 31 December 2015. A backtest that uses it for all of 2015 holds every company added during the year from the first trading day of January, often months before any announcement, and drops every member removed during the year from the start rather than from the day it left.
That is look-ahead bias, acting on information that was not public on the trade date; the guide to look-ahead bias in backtesting covers the general problem. Here the leak has a predictable direction. The index admits companies that pass its size and earnings tests, usually after a period of growth, and removes members that have shrunk, been acquired or stopped qualifying, so a December list buys the run-up before an addition and skips the slide before a removal.
Survivorship bias, where today’s roster stands in for every past year, is a separate error, tested in an earlier comparison of today’s roster with point-in-time rosters. A year-end list is never more than twelve months ahead, so the question is whether that much foresight changes a result.
Three rosters over the same 300 months
- Draw the S&P 500 roster on the last business day of each month from December 1999 to December 2024 with
xfl.index("sp500", as_of=...). - Point-in-time book: each month-end roster sets the next month’s holdings, January 2000 to December 2024.
- December book: the year’s last month-end roster sets the holdings for all twelve months, as a list labelled with the year would.
- January book: the previous December’s roster sets them instead. It goes stale but uses no future information, which separates staleness from foresight.
- Pull monthly total returns for all 1,067 securities, keyed by entity id so a recycled ticker cannot swap companies, and weight holdings equally. A holding that stops trading earns its return through its last trading day.
- Split the December book’s lead into companies held before they joined and members dropped before they left.
The index membership reference documents as_of; 301 dated rosters need a paid plan.
Code
import pandas as pd
import xfinlink as xfl

xfl.set_api_key("YOUR_API_KEY")  # free at https://xfinlink.com/signup

def roster(d):
    return set(xfl.index("sp500", as_of=d.strftime("%Y-%m-%d")).entity_id.dropna().astype(int))

# Rosters on the last business day of each month, Dec 1999 to Dec 2024.
# The month-end roster sets the holdings for the following month.
month_ends = pd.date_range("1999-12-01", "2024-12-31", freq="BME")
at = {d.to_period("M"): roster(d) for d in month_ends}
pit = {m + 1: at[m] for m in at if m < pd.Period("2024-12", "M")}
year_end = {y: at[pd.Period(f"{y}-12", "M")] for y in range(2000, 2025)}   # known only on 31 Dec
year_start = {y: at[pd.Period(f"{y - 1}-12", "M")] for y in range(2000, 2025)}

# Monthly total returns for every company any of the rosters holds
ids = sorted(set().union(*at.values()))
px = pd.concat(xfl.prices(entity_id=ids[i:i + 25], start="2000-01-01", end="2024-12-31",
                          interval="1mo", fields=["return_daily"], max_rows=100_000)
               for i in range(0, len(ids), 25))
px["month"] = px["date"].dt.to_period("M")
ret = px.pivot(index="month", columns="entity_id", values="return_daily").loc["2000-01":"2024-12"]
print(f"{len(at)} month-end rosters, {len(ids)} securities, {len(ret)} holding months")

def mask(members):
    return pd.DataFrame([ret.columns.isin(list(members(m))) for m in ret.index],
                        index=ret.index, columns=ret.columns)

m_pit = mask(lambda m: pit[m])
m_end = mask(lambda m: year_end[m.year])
m_start = mask(lambda m: year_start[m.year])
books = {"Point-in-time rosters": m_pit,
         "December roster, applied all year": m_end,
         "January roster, applied all year": m_start}

annual = lambda r: (1 + r).prod() ** (12 / len(r)) - 1
yearly = lambda r: (1 + r).groupby(r.index.year).prod() - 1
res = {name: ret.where(mk).mean(axis=1) for name, mk in books.items()}
for name, r in res.items():
    print(f"{name}: {annual(r):.2%} a year, $1 grows to ${(1 + r).prod():.2f}")

gap = yearly(res["December roster, applied all year"]) - yearly(res["Point-in-time rosters"])
stale = annual(res["January roster, applied all year"]) - annual(res["Point-in-time rosters"])
print(f"December roster beats point-in-time by "
      f"{annual(res['December roster, applied all year']) - annual(res['Point-in-time rosters']):.2%} "
      f"a year, ahead in {(gap > 0).sum()} of {len(gap)} years; January roster: {stale:+.2%} a year")

# Where the lift comes from: the two groups of holdings that differ
early = m_end & ~m_pit       # held before the month they joined the index
dropped = m_pit & ~m_end     # members the December list leaves out because they leave later that year
mid = ret.where(m_pit & m_end).mean(axis=1)
print(f"Average holdings differing per month: {early.sum(axis=1).mean():.1f} early additions, "
      f"{dropped.sum(axis=1).mean():.1f} members removed later that year")
print(f"Removing the later leavers alone: {annual(mid) - annual(res['Point-in-time rosters']):+.2%} a year; "
      f"adding the early arrivals: {annual(res['December roster, applied all year']) - annual(mid):+.2%} a year")
base = ret.where(m_pit).stack().dropna()
for label, g in [("Early additions", early), ("Members removed later that year", dropped)]:
    r = ret.where(g).stack().dropna()
    print(f"{label}: {len(r)} stock-months, average month {r.mean():.2%}, median {r.median():.2%} "
          f"(point-in-time holdings: {base.mean():.2%}, median {base.median():.2%})")
Full script with formatting and visualisation: lookahead-bias-year-end-sp500-roster-python.py
Output
301 month-end rosters, 1067 securities, 300 holding months
Point-in-time rosters: 9.79% a year, $1 grows to $10.33
December roster, applied all year: 11.19% a year, $1 grows to $14.16
January roster, applied all year: 10.00% a year, $1 grows to $10.84
December roster beats point-in-time by 1.40% a year, ahead in 25 of 25 years; January roster: +0.21% a year
Average holdings differing per month: 13.7 early additions, 13.6 members removed later that year
Removing the later leavers alone: +0.54% a year; adding the early arrivals: +0.85% a year
Early additions: 3642 stock-months, average month 3.18%, median 2.50% (point-in-time holdings: 0.91%, median 1.01%)
Members removed later that year: 4017 stock-months, average month -0.86%, median 0.21% (point-in-time holdings: 0.91%, median 1.01%)
How 14 names a month move a 500-stock book
In an average month the December roster lists 13.7 companies the index has not yet added and leaves out 13.6 current members, under 3% of the roster each. Those names are extreme in opposite directions: the early additions averaged 3.18% a month (median 2.50%) in the months before they joined, against 0.91% (median 1.01%) for the stocks actually in the index, while the members removed later in the year averaged -0.86% (median 0.21%), pulled down by collapses such as Lehman Brothers.
Adding the early arrivals accounts for 0.85 of the 1.40 points and dropping the later leavers for 0.54. The largest gaps fall in 2000 (5.70 points), 2020 (3.23) and 2008 (2.87). Tesla is the most visible 2020 case: announced on 16 November 2020 and added on 21 December, it sits in the December book from January, through a year in which its shares returned 743%. The smallest gap, 0.08 points in 2016, is still positive.
Outliers do not drive it: capping every monthly return at +100% leaves the gap at 1.39 points. The January book keeps departing members a few months too long and misses new members’ first months, but those errors carry no knowledge of which companies were about to rise or fall, and it ends 0.21 points ahead.
Which roster a backtest should use for each month
Use the roster in force on each rebalance date; the historical S&P 500 constituents lookup lists the members on any past date, companies that later left included. Where only yearly lists exist, file each under the following year, never its own: the start-of-year roster moved the result 0.21 points through staleness, the end-of-year roster 1.40 points through foresight.
In this equal-weight test the leak was worth 1.40 points a year; an edge of similar size measured on same-year lists cannot be separated from it without point-in-time rosters. Rules trading more often than monthly need daily membership; a measurement of stale rosters across refresh schedules covers how far a roster drifts between pulls.
Built with xfinlink — free financial data API for Python.