
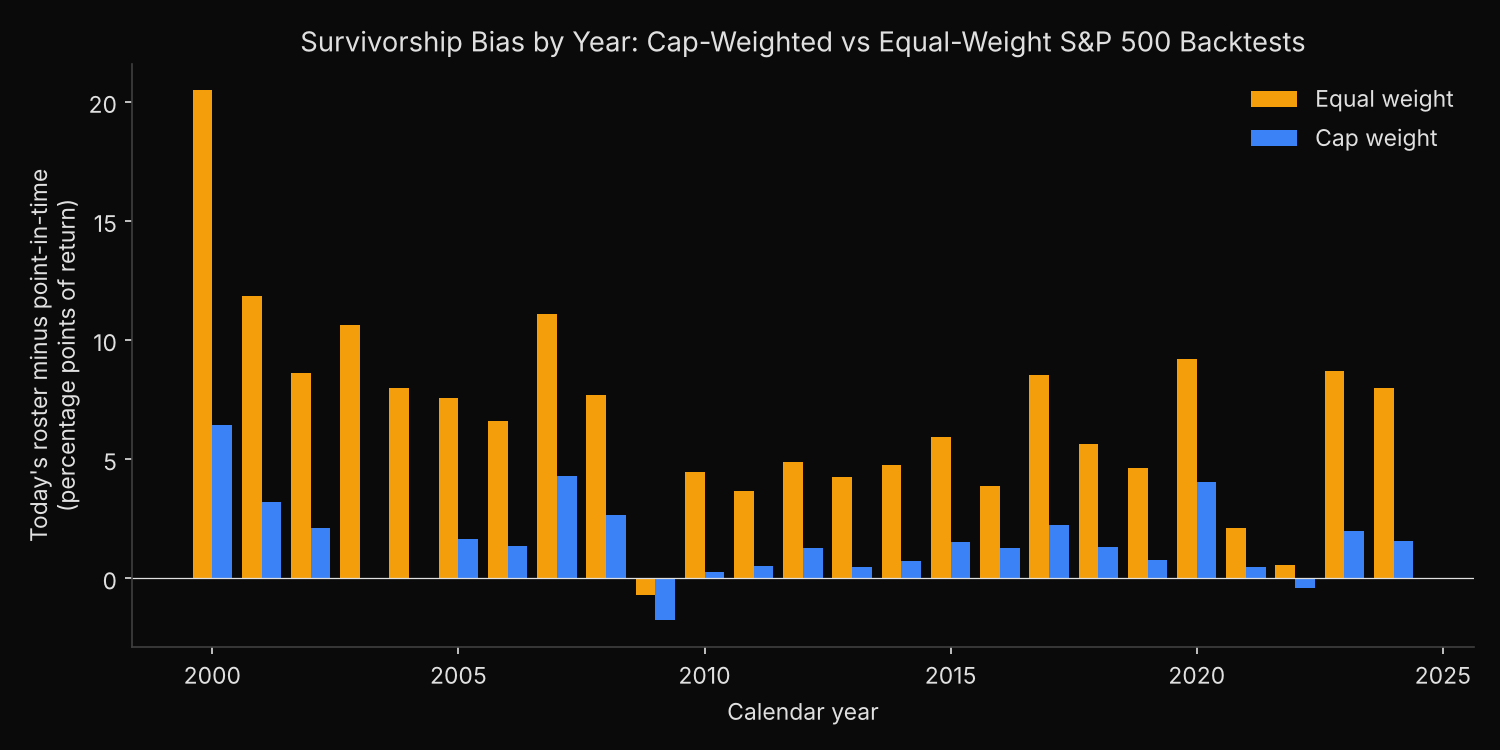
Cap-weighting cuts the survivorship bias in an S&P 500 backtest from 6.99 to 1.63 percentage points a year, but does not remove it. Those are the annual lifts over 2000-2024 from running a monthly-rebalanced portfolio on today’s roster instead of each month’s actual roster, first in equal weight and then weighted by market value. The smaller gap still compounds: $1 grows to $9.46 on today’s roster against $6.51 on the point-in-time rosters, 45% more ending wealth.
Why would portfolio weights change survivorship bias?
Survivorship bias is the error of testing on a universe chosen with knowledge of the future, here the companies in the S&P 500 today; the guide to survivorship bias in backtesting explains where it comes from. Two groups cause it in an index backtest: members later removed are missing, and companies that joined later are held in years before they were members, often while still small.
An equal-weight portfolio gives each of them the same share as Microsoft; a cap-weighted portfolio, which holds each stock in proportion to its market value, gives a small company a small share. If the biased names are mostly small, cap-weighting should shrink the error that equal-weight tests, such as an earlier equal-weight comparison of the two rosters, report.
Three universes, two weighting rules
- Draw the S&P 500 roster on the last business day of each month from December 1999 to November 2024 with
xfl.index("sp500", as_of=...). Each sets the next month’s holdings, January 2000 to December 2024. - Draw today’s roster once and apply it to every month.
- Build a third universe from each month’s members that are still in the index today. It splits the bias into two steps: dropping later-removed members, then adding companies not yet joined.
- Pull monthly total returns and month-end market values for every security, keyed by entity id so a recycled ticker cannot swap companies.
- Weight each universe two ways: equally across the holdings with a return that month, or by each holding’s market value at the previous month end. A holding that stops trading earns its return through its last trading day.
Market value is price times shares outstanding for each share class, so the weights follow total market value rather than the float-adjusted value the index has used since 2005. The index membership reference documents the as_of call; 300 dated rosters and 25 years of monthly prices need a paid plan.
Code
import pandas as pd
import xfinlink as xfl

xfl.set_api_key("YOUR_API_KEY")  # free at https://xfinlink.com/signup

# The S&P 500 roster on the last business day of each month, Dec 1999 to Nov 2024,
# sets the holdings for the following month
dates = pd.date_range("1999-12-01", "2024-11-30", freq="BME")
pit = {d.to_period("M") + 1: set(xfl.index("sp500", as_of=d.strftime("%Y-%m-%d"))
                                 .entity_id.dropna().astype(int)) for d in dates}
today = set(xfl.index("sp500").entity_id.dropna().astype(int))

# Monthly total returns and month-end market values for every company either roster holds
ids = sorted(set().union(*pit.values()) | today)
px = pd.concat(xfl.prices(entity_id=ids[i:i + 25], start="1999-11-01", end="2024-12-31",
                          interval="1mo", fields=["return_daily", "market_cap"], max_rows=100_000)
               for i in range(0, len(ids), 25))
px["month"] = px["date"].dt.to_period("M")
ret = px.pivot(index="month", columns="entity_id", values="return_daily")
cap = px.pivot(index="month", columns="entity_id", values="market_cap").shift(1)  # prior month end
ret, cap = ret.loc["2000-01":], cap.loc["2000-01":]
print(f"{len(pit)} monthly rosters, {len(ids)} securities, {len(ret)} holding months")

def membership(members):
    return pd.DataFrame([ret.columns.isin(list(members(m))) for m in ret.index],
                        index=ret.index, columns=ret.columns)

pit_mask, today_mask = membership(lambda m: pit[m]), membership(lambda m: today)
books = {"Point-in-time rosters": pit_mask,
         "Members then, still in today's index": pit_mask & today_mask,
         "Today's roster": today_mask}

def book_returns(mask):
    held = ret.where(mask)
    w = cap.where(mask & held.notna())
    return {"equal weight": held.mean(axis=1),
            "cap weight": (held * w).sum(axis=1) / w.sum(axis=1)}, w

annual = lambda r: (1 + r).prod() ** (12 / len(r)) - 1
yearly = lambda r: (1 + r).groupby(r.index.year).prod() - 1
res, weights = {}, {}
for name, mask in books.items():
    res[name], weights[name] = book_returns(mask)
    for scheme, r in res[name].items():
        print(f"{name}, {scheme}: {annual(r):.2%} a year, volatility {r.std() * 12 ** 0.5:.2%}, "
              f"$1 grows to ${(1 + r).prod():.2f}")

gap = {}
for scheme in ["equal weight", "cap weight"]:
    pit_r, mid_r, today_r = (res[n][scheme] for n in books)
    gap[scheme] = yearly(today_r) - yearly(pit_r)
    print(f"{scheme}: today's roster beats point-in-time by {annual(today_r) - annual(pit_r):.2%} a year "
          f"({annual(mid_r) - annual(pit_r):.2%} from dropping later-removed members, "
          f"{annual(today_r) - annual(mid_r):.2%} from adding names not yet in the index); "
          f"ahead in {(gap[scheme] > 0).sum()} of {len(gap[scheme])} years")

# How much weight each biased group carries, averaged over the 300 months
def share(name, group):
    held = ret.where(books[name]).notna()
    w = weights[name]
    return (held & group).sum(axis=1).div(held.sum(axis=1)).mean(),         w.where(group).sum(axis=1).div(w.sum(axis=1)).mean()
ew, cw = share("Point-in-time rosters", ~today_mask)
print(f"Point-in-time book, members later removed: {ew:.1%} of holdings equal-weighted, {cw:.1%} cap-weighted")
ew, cw = share("Today's roster", ~pit_mask)
print(f"Today's-roster book, names not yet in the index: {ew:.1%} of holdings equal-weighted, {cw:.1%} cap-weighted")
w = weights["Point-in-time rosters"].iloc[0].dropna()
w = w / w.sum()
print(f"January 2000, point-in-time book: equal weight {1 / len(w):.2%} a name; cap weights "
      f"{w.min():.3%} to {w.max():.2%}, median {w.median():.3%}")
Full script with formatting and visualisation: survivorship-bias-cap-weighted-vs-equal-weight-python.py
Output
300 monthly rosters, 1100 securities, 300 holding months
Point-in-time rosters, equal weight: 9.79% a year, volatility 17.69%, $1 grows to $10.33
Point-in-time rosters, cap weight: 7.78% a year, volatility 15.29%, $1 grows to $6.51
Members then, still in today's index, equal weight: 12.74% a year, volatility 16.31%, $1 grows to $20.05
Members then, still in today's index, cap weight: 8.84% a year, volatility 14.86%, $1 grows to $8.30
Today's roster, equal weight: 16.78% a year, volatility 16.77%, $1 grows to $48.29
Today's roster, cap weight: 9.40% a year, volatility 15.01%, $1 grows to $9.46
equal weight: today's roster beats point-in-time by 6.99% a year (2.95% from dropping later-removed members, 4.04% from adding names not yet in the index); ahead in 24 of 25 years
cap weight: today's roster beats point-in-time by 1.63% a year (1.06% from dropping later-removed members, 0.57% from adding names not yet in the index); ahead in 21 of 25 years
Point-in-time book, members later removed: 38.6% of holdings equal-weighted, 17.7% cap-weighted
Today's-roster book, names not yet in the index: 28.8% of holdings equal-weighted, 5.3% cap-weighted
January 2000, point-in-time book: equal weight 0.20% a name; cap weights 0.003% to 4.96%, median 0.064%
Where the cap-weighted gap comes from
Under equal weight the survivor roster returns 16.78% a year against 9.79% for the point-in-time rosters. Cap-weighting the same holdings brings the two to 9.40% and 7.78%, which cuts the gap by more than three-quarters, from 6.99 to 1.63 points a year.
The last three lines of the output show why. Members the index later removed made up 38.6% of the point-in-time book’s holdings in an average month but only 17.7% of its market value. Companies on today’s roster that had not yet joined made up 28.8% of the survivor book’s holdings and 5.3% of its value. In January 2000 the median member weighed 0.064% by market value, about a third of its 0.20% equal weight, while the largest, Microsoft, weighed 4.96%.
The two steps shrink unevenly. Adding future members is the larger step under equal weight, 4.04 of the 6.99 points, and cap-weighting cuts it to 0.57, because a company that later joined was usually small in the years the survivor book holds it early. Dropping later-removed members falls only from 2.95 to 1.06 points and becomes most of the cap-weighted gap: some removed companies were large before they declined, such as Lucent Technologies, among the ten largest weights of January 2000.
The cap-weighted gap is persistent, positive in 21 of 25 calendar years; 2009 is the only year both weightings put the survivor roster behind.
When a cap-weighted backtest still needs point-in-time rosters
A cap-weighted backtest on today’s roster is far less wrong than an equal-weight one, but not safe: a 1.63-point lift is about a fifth of the point-in-time book’s 7.78% annual return. A cap-weighted strategy tested on survivors that beats the index by less than that margin has shown nothing yet.
Any rule that gives smaller members more weight than the index does inherits more of the equal-weight bias, because the bias sits in the small end of the index. Those tests need the roster in force on each rebalance date. The historical S&P 500 constituents lookup lists the members on any past date, companies that later left included, and a count of how many members stay in the index for 20 years covers the turnover that drives both steps.
Built with xfinlink — free financial data API for Python.