
An S&P 500 roster refreshed once a year was wrong on 20.9 names on an average weekday from 1990 to 2025, counting members it still held after their last day in the index and new members it had not yet added. A monthly refresh cut that to 1.7 names. Since 2020, 45% of additions and removals have been dated in the quarterly rebalance window, against fewer than 4% from 1990 to 2009, so the refresh day now matters as well as the frequency.
How often do S&P 500 companies change?
The index has no fixed membership calendar. S&P Dow Jones Indices announces each change in a press release, and its recent quarterly changes take effect on the Monday after the third Friday of March, June, September and December: the release of 4 September 2026 set changes “effective prior to the open of trading on Monday, September 21, 2026, to coincide with the quarterly rebalance”, and the March 2026 release named Monday, 23 March. The rest take effect on other dates through the year.
A backtest often pulls a constituent list once a year, typically each January, and holds it until the next pull, so between pulls the list keeps members the index has already dropped and lacks the ones it has added. A survivorship-free list settles which companies were members; refresh frequency decides how current that list is on a given day. An earlier post compares a backtest run on each January’s S&P 500 roster with one run on today’s; this one measures how far the January roster itself drifts.
Rebuilding the true roster for every weekday since 1990
- Page through the full S&P 500 event log with
index_events: 3,612 dated additions and removals from 1928 to October 2026. The guide to S&P 500 additions and deletions history explains which date each row carries. - Turn the log into membership spells keyed by
entity_id, from an addition’s first day in the index to a removal’s last day, giving each member’s status on every weekday from 1990 to 2025. - Simulate five refresh schedules (1 January, twice a year, the first day of each calendar quarter, each rebalance Monday, the first of every month), holding each roster until the next pull.
- On each weekday, count the names wrong: members held after their last day plus members missing after their first day. One swap the list has missed counts as two.
- Count the additions and removals dated from a rebalance Friday to the Monday after, by five-year period from 1980.
Pulling rosters with as_of gives the same answer: the rosters of 3 January and 22 December 2000 differ by the same 53 removed and 53 added members the log produces. The full event log is on paid plans; as_of rosters work on every plan.
Code
import numpy as np
import pandas as pd
import xfinlink as xfl

xfl.set_api_key("YOUR_API_KEY")  # free at https://xfinlink.com/signup

def all_events():
    pages = [xfl.index_events("sp500", start="1925-12-31")]
    while len(pages[-1]) == 1000:  # one call returns at most 1,000 rows
        pages.append(xfl.index_events("sp500", start="1925-12-31", offset=1000 * len(pages)))
    return pd.concat(pages, ignore_index=True)

def third_friday(year, month):
    d = pd.Timestamp(year, month, 15)
    return d + pd.Timedelta(days=(4 - d.weekday()) % 7)

ev = all_events()
ev["key"] = np.where(ev["entity_id"].notna(), ev["entity_id"].astype("Int64").astype(str), "ticker " + ev["ticker"].fillna(""))
ev["date"] = pd.to_datetime(ev["effective_date"])

# membership spells: first day in (added) to last day in (removed)
spells = []
for key, g in ev.sort_values(["date", "event_type"]).groupby("key"):
    opened = pd.Timestamp("1900-01-01")  # removal with no addition on record: in since before 1925
    for _, row in g.iterrows():
        if row["event_type"] == "added":
            opened = row["date"]
        else:
            spells.append((key, opened, row["date"]))
            opened = None
    if opened is not None:
        spells.append((key, opened, pd.Timestamp("2099-12-31")))

# the true roster on every weekday, 1990-2025
days = pd.bdate_range("1990-01-01", "2025-12-31")
col = {k: i for i, k in enumerate(sorted({s[0] for s in spells}))}
member = np.zeros((len(days), len(col)), dtype=bool)
for key, first, last in spells:
    member[:, col[key]] |= (days >= first) & (days <= last)

years = range(1990, 2026)
schedules = {
    "yearly": [pd.Timestamp(y, 1, 1) for y in years],
    "twice a year": [pd.Timestamp(y, m, 1) for y in years for m in (1, 7)],
    "quarterly": [pd.Timestamp(y, m, 1) for y in years for m in (1, 4, 7, 10)],
    "rebalance Monday": [third_friday(y, m) + pd.Timedelta(days=3) for y in years for m in (3, 6, 9, 12)],
    "monthly": [pd.Timestamp(y, m, 1) for y in years for m in range(1, 13)],
}
for name, dates in schedules.items():
    pulled = np.searchsorted(days, pd.DatetimeIndex(dates))  # roster pulled on these weekdays
    held = pulled[np.searchsorted(pulled, np.arange(len(days)), side="right") - 1]
    ok = days >= days[pulled[0]]
    wrong = pd.Series((member[held] != member).sum(axis=1), index=days)[ok]
    print(name, wrong.groupby(np.minimum(wrong.index.year // 10 * 10, 2020)).mean().round(1).to_dict(),
          round(wrong.mean(), 1), wrong.max(), wrong.idxmax().date())

# share of additions and removals dated in the rebalance window (third Friday to the Monday after)
ch = ev[(ev["date"] >= "1980-01-01") & (ev["date"] <= "2025-12-31")]
tf = [third_friday(d.year, d.month) for d in ch["date"]]
in_window = pd.Series([d.month % 3 == 0 and t <= d <= t + pd.Timedelta(days=3) for d, t in zip(ch["date"], tf)])
print(in_window.groupby(ch["date"].dt.year.values // 5 * 5).agg(["size", "sum", "mean"]).round(2))
Full script with formatting and visualisation: sp500-roster-refresh-frequency-python.py
Output
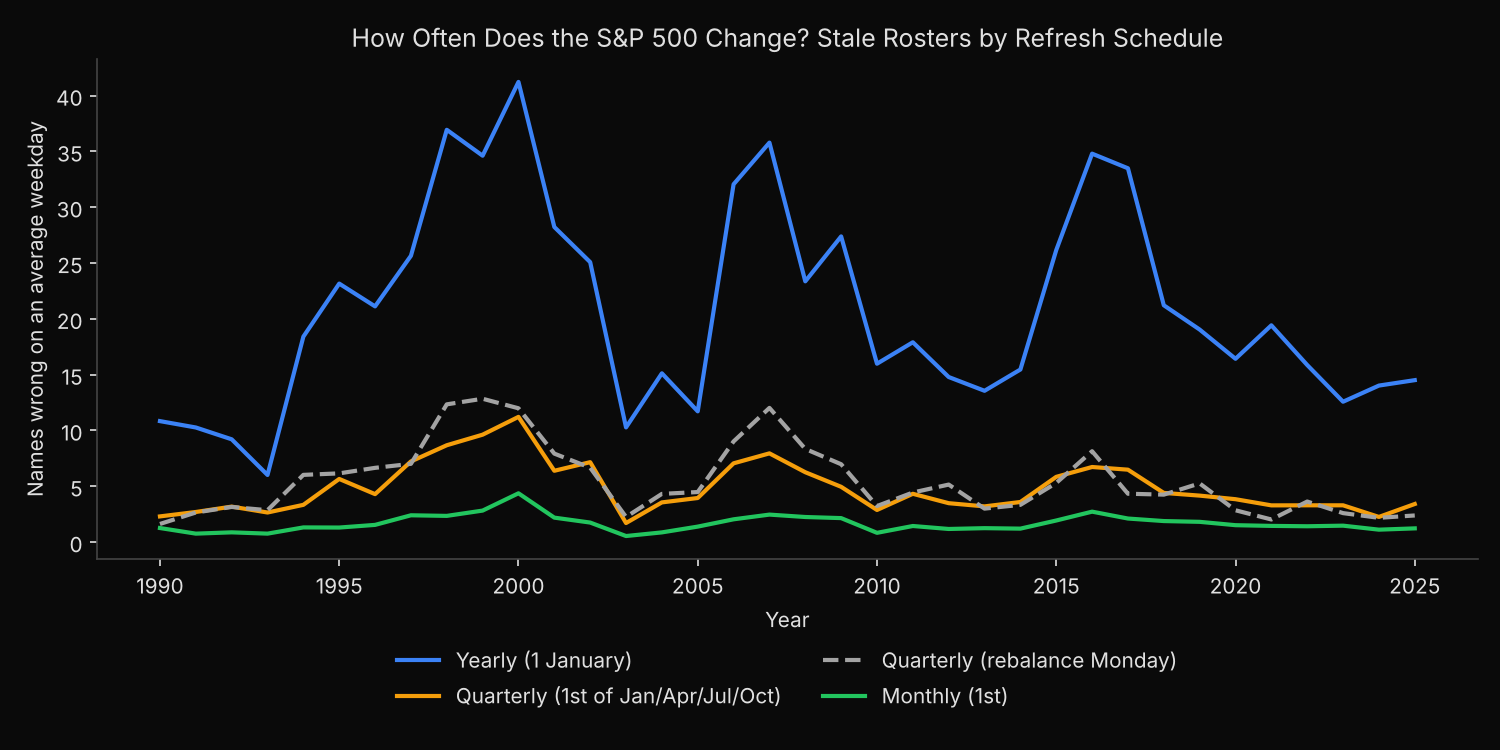
Names wrong on an average weekday (held after removal + missing after addition)
                                    1990s  2000s  2010s  2020-25   all share  worst   worst_day
schedule
Yearly (1 January)                   19.6   25.0   21.2     15.5  20.9  4.2%    106  2000-12-22
Twice a year                         10.4   12.6    9.5      7.5  10.3  2.1%     62  2000-12-22
Quarterly (1st of Jan/Apr/Jul/Oct)    5.0    6.0    4.5      3.2   4.8  1.0%     46  2000-12-22
Quarterly (rebalance Monday)          6.2    7.4    4.6      2.6   5.5  1.1%     46  2000-12-14
Monthly (1st)                         1.5    2.0    1.6      1.4   1.7  0.3%     24  2000-12-22

Additions and removals by period, and the share in the rebalance window
         events  in_window  per_year in_window_share
period
1980-84     230          0      46.0              0%
1985-89     276          2      55.2              1%
1990-94     122          2      24.4              2%
1995-99     325          4      65.0              1%
2000-04     273         12      54.6              4%
2005-09     302         22      60.4              7%
2010-14     176         36      35.2             20%
2015-19     297         47      59.4             16%
2020-24     180         80      36.0             44%
2025         40         20      40.0             50%
Why the yearly roster drifted furthest around 2000
The yearly schedule’s error follows the number of changes. Its worst day was 22 December 2000, when the January roster was 53 removals and 53 additions out of date at the end of the busiest year in the window (110 events). The other peaks on the chart, 1998–99, 2007 and 2016, are also among the busiest years, with 76 to 84 events each.
Frequency does most of the work: 20.9 wrong names for a yearly refresh, 10.3 for twice a year, 4.8 for quarterly and 1.7 for monthly. The worst day shrinks less, from 106 names to 24, since a burst of changes can still land between two monthly pulls: 12 swaps took effect between 1 and 22 December 2000.
Timing started to matter only recently. Through the 2000s a refresh on each rebalance Monday did worse than one on the first day of each calendar quarter, 7.4 names against 6.0; with so few changes dated in the rebalance window, the Monday had no advantage to offer. From 2020 to 2025 the order reversed, 2.6 against 3.2, as 100 of the 220 events fell in that window. The other 120 still arrived between rebalances, which is why no quarterly schedule reaches the monthly figure.
How often to refresh a backtest’s S&P 500 universe
Pull the roster on the dates the strategy trades. A monthly strategy that takes the members on each rebalance date instead of reusing January’s list removes about 19 of the 21 wrong names on an average day. A daily strategy, or a study of returns around index changes, needs membership by day, built from the event log as above. For a quarterly strategy tested on 2020–2025 data, refreshing on the rebalance Monday rather than the quarter’s first day removes part of the remaining drift at no cost.
Membership on any date is one call, index("sp500", as_of=date), set out in the index membership reference. The historical S&P 500 constituents lookup shows the same rosters for any past date without code.
Built with xfinlink — free financial data API for Python.